|
|

Computed
Tomography Image Formation
|
|
Computed
Tomography Image Formation
To begin module, CLICK HERE.
|
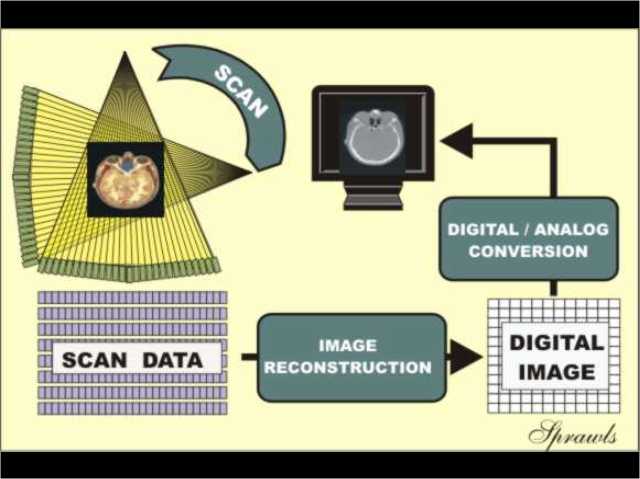
The scanning phase produces data, but not an image. The reconstruction phase processes the acquired data and forms a digital image. The visible and displayed analog image (shades of gray) is produced by the digital-to analog conversion phase. There are adjustable factors associated with each of these phases that can have an effect on the characteristics and quality of the image. |
|
The amount of x-radiation that penetrates the body along each individual ray (pathway) through the body is measured by the detectors that intercept the x-ray beam after it passes through the body. |
|
Each of these characteristics are affected by the selection of protocol factor values that control the imaging process. |
|
Many views projected from around the patient's body are required in order to acquire the necessary data to reconstruct an image. |
|
Illustration from Scientific American |
|
As the ray passes through the body, it measures the total x-ray attenuation (or penetration) along it's path. This is the data recorded by the detector. A view, as seen previously, is made-up of many individual rays.
Illustration from Scientific American |
|
Each view produces one "profile" or line of data as shown here. The complete scan produces a complete data set that contains sufficient information for the reconstruction of an image. In principle, one scan produces data for one slice image. However, with spiral/helical scanning, there is not always a one-to-one relationship between the number of scans around the body and the number of slice images produced. |
|
During the image reconstruction process, the slice of tissue is divided into a matrix of voxels (volume elements). As we will see later, a CT number is calculated and displayed in each pixel of the image. The value of the CT number is calculated from the x-ray attenuation properties of the corresponding tissue voxel. |
|
One motion is the scanning of the beam around the body as we have just seen. The other motion is the movement of the beam along the length of the body. Actually, this is achieved by moving the body through the beam as it is rotating around. |
|
It works like this, one complete scan around the body is made while the body is not moving. Then the body is moved to the next slice position. The principle characteristic (and limitation) of this mode is that the data set is fixed to a specific slice of tissue. This means that the slice thickness, position, and orientation is "locked in" during the scanning phase. We are about to see that spiral/helical scanning offers an alternative. |
|
The patient's body is moved continuously as the x-ray beam is scanned around the body. This motion is controlled by the operator selected value of the pitch factor. As illustrated, the pitch value is the distance the body is moved during one beam rotation, expressed as multiples of the x-ray beam width or thickness. If the body is moved 10 mm during one rotation, and the beam width is 5 mm, the pitch will have a value of 2. |
|
However, it is helpful to think of it from this perspective like we were moving along with the patient. What we see is the beam moving along the body, distributing radiation and collecting data continuously. |
|
During the same time (as illustrated), the x-ray beam will be spread over more of the body when the pitch is increased. This has three major effects.
|
|
A specific CT machine can be designed to have either a single row of detectors or multiple rows as shown. There are advantages in having multiple rows. |
|
This is especially significant when covering a relatively large body section with thin beams for the purpose of producing thin, high-detail slice images or 3-D volume images. |
|
The data set is not broken up into slices as with the scan/step slice acquisition method. As we will soon see, the volume data set can be sliced many ways later during the image reconstruction phase. |
|
|
|
Images of overlapping slices can be created. The reconstruction can be repeated to produce images with different spatial characteristics. |
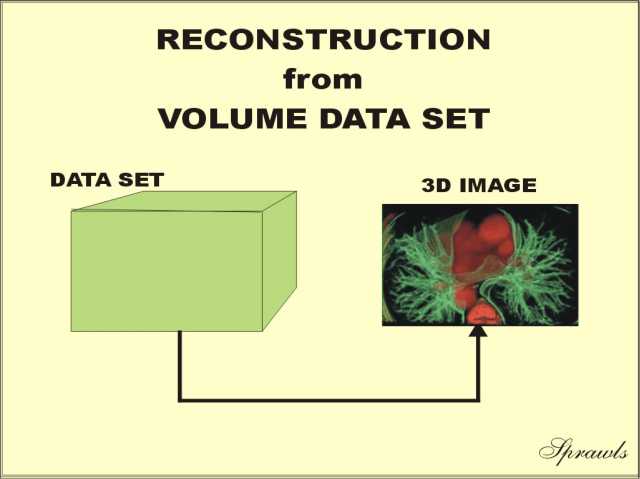 A general requirement for good-quality 3-D images is that the data set have "good detail" in the long patient axis direction. This is achieved by scanning with thin beams and relatively low pitch values. |
|
Filtered back projection is the reconstruction method used in CT. "Filtered" refers to the use of the digital image processing algorithms that are used to improve image quality or change certain image quality characteristics, such as detail and noise. "Back projection" is the actual process used to produce or "reconstruct" the image. It will be illustrated later. |
|
This
is a very simple example illustrating the principle of
image reconstruction by
back projection. We start with one scan view through a body section (like a head) that contains two objects. As we know, the data produced is not a complete image, but a profile of the x-ray attenuation by the objects. Let's now take this profile and attempt to draw an image by "back projecting" the profile onto our image surface. As we see, there is only enough information in the profile to allow us to draw in streaks, kind of like shadows across the image area. |
|
If we now back project this profile onto our image area we see the beginnings of an image showing the two object. Two views does not give us a high-quality image. Several hundred views are used to produce clinical CT images. |
|
A part of the reconstruction process is the calculation of CT number values for each image pixel. |
|
The CT numbers are calculated from the x-ray linear attenuation coefficient values for each individual tissue voxel. It is the attenuation coefficient that is first calculated by the reconstruction process and then used to calculate the CT number values. Note that water is the reference material for CT numbers and has an assigned value of zero. Tissues or materials with attenuation (density) greater than water will have positive CT numbers. Those that are less dense will have negative CT numbers. X-ray attenuation depends on both the density and atomic number (Z) of materials and the energy of the x-ray photons. For CT imaging a high KV (like 120-140) and heavy beam filtration is used. This minimizes the photoelectric interactions that are influenced by the Z of a material. Therefore, CT numbers are determined by the density of the tissues or materials. CT numbers are in Hounsfield Units. |
|
|
|
The scan phase produces a data set, but not an image. The image reconstruction phase produces a digital image from the scan data set by the process of filtered back projection. We now move to the final phase in which the digital image is converted into a visible analog image. |
|
There are several adjustable factors that control this process. The windowing has level and width controls The area of the digital image that is actually displayed is controlled by the zoom control. We will now look at both of these. |
|
Tissues within the window will have different shades of gray (brightness) and will have visible contrast. All tissues and materials that have CT numbers above the window will be all white and no contrast within this range. All that have CT numbers below the window will be all black and without contrast. The level control adjust the center of the window. The width control adjust the range of CT numbers that will be displayed with contrast. The width controls the contrast in the displayed image. Reducing window width increases the displayed image contrast among the tissues. The ability to window is what gives CT a very high contrast sensitivity. This is because a window can be set to display and make visible very small differences in tissue densities. |
|
It is in principle a magnification mode in that it enlarges a small area. Zooming is very different from changing the field of view during image reconstruction. As we will see in the next module (CT Image Quality and Dose Management) reducing the field of view has the effect of increasing image detail. Zooming does not have the same effect. |
|
To return to the beginning,
|
 The
formation of a CT image is a distinct three
phase process.
The
formation of a CT image is a distinct three
phase process.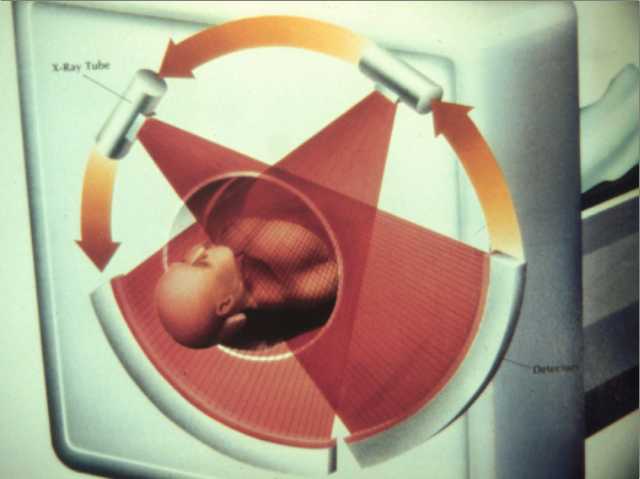 During
the scanning phase a fan-shaped x-ray beam
is scanned around the body.
During
the scanning phase a fan-shaped x-ray beam
is scanned around the body.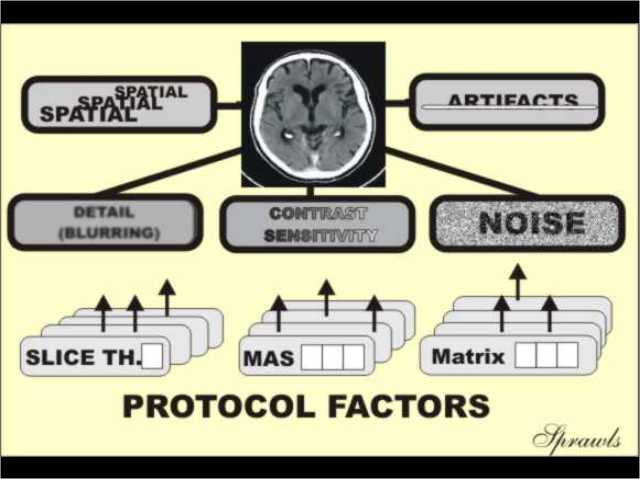 Like
all medical images, CT images have the five
specific image quality characteristics. They are:
Like
all medical images, CT images have the five
specific image quality characteristics. They are: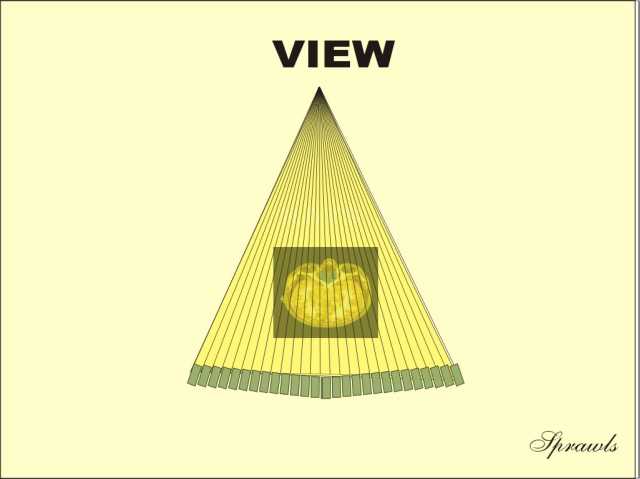 The
projection of the fan-shaped x-ray beam
from one specific x-ray tube focal spot position produces one
view.
The
projection of the fan-shaped x-ray beam
from one specific x-ray tube focal spot position produces one
view.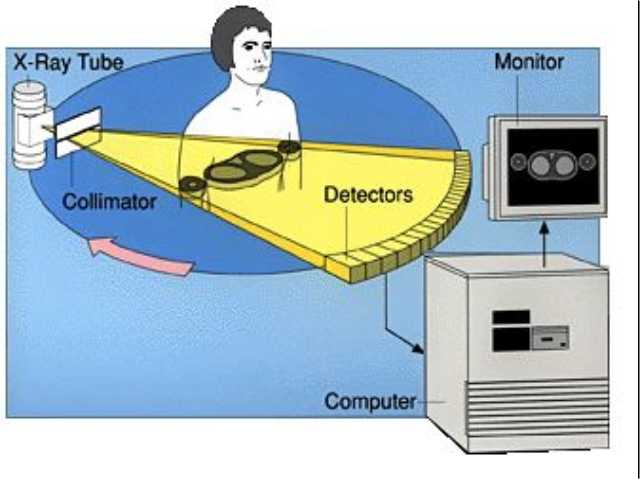 As
the x-ray beam is scanned around the body,
forming many views, the data recorded by
the detectors are stored in computer memory for later image
reconstruction.
As
the x-ray beam is scanned around the body,
forming many views, the data recorded by
the detectors are stored in computer memory for later image
reconstruction.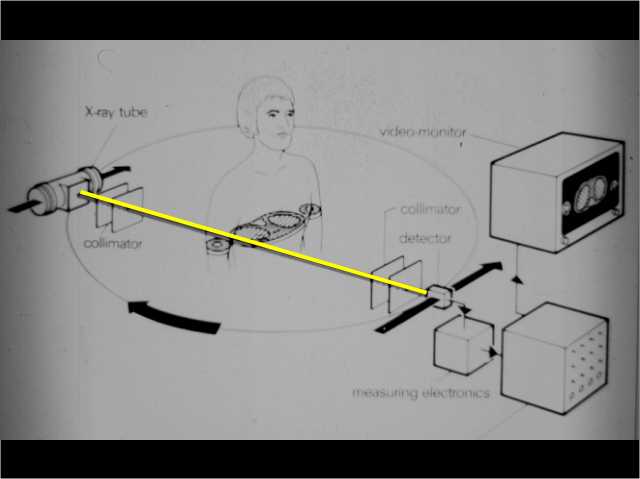 A
ray is the pathway of a portion of the
x-ray beam from one specific focal-spot position
to a specific detector position.
A
ray is the pathway of a portion of the
x-ray beam from one specific focal-spot position
to a specific detector position.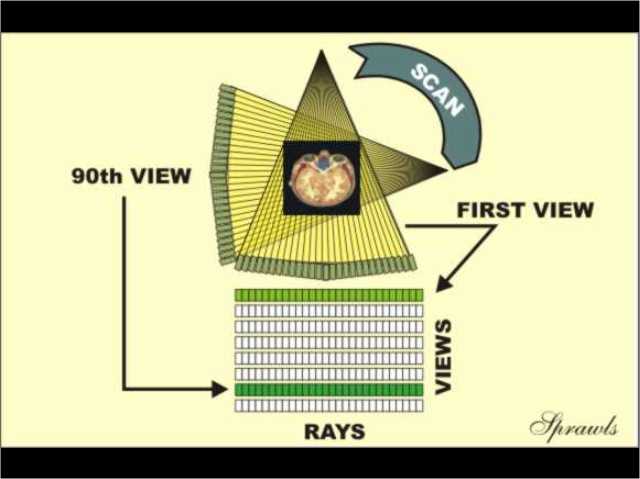 A
complete scan is formed by rotating the
x-ray tube completely around the body and
projecting many views.
A
complete scan is formed by rotating the
x-ray tube completely around the body and
projecting many views. The
principle objective of CT imaging is to produce a
digital image (a matrix of pixels) for a
specific slice of tissue.
The
principle objective of CT imaging is to produce a
digital image (a matrix of pixels) for a
specific slice of tissue.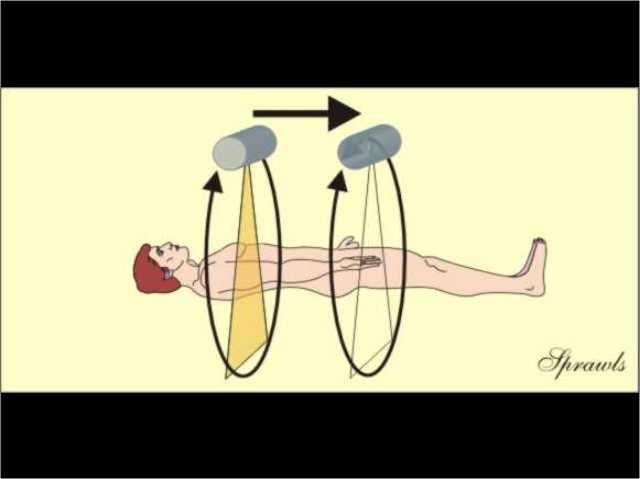 There
are two distinct motions of the x-ray beam
relative to the patient's body during CT imaging.
There
are two distinct motions of the x-ray beam
relative to the patient's body during CT imaging.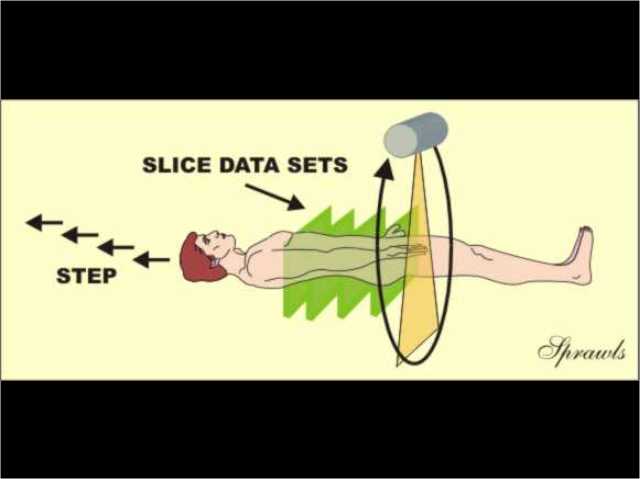 Scan
and step is one mode of scanning. It
was the first scanning mode developed and is still used today for some
procedures.
Scan
and step is one mode of scanning. It
was the first scanning mode developed and is still used today for some
procedures.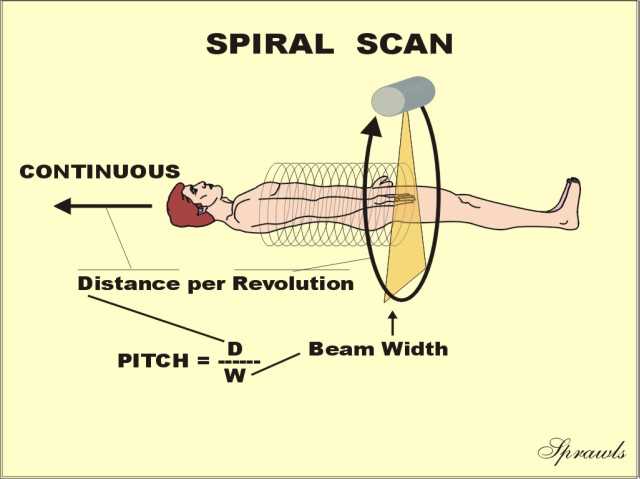 Spiral
or helical scanning (both names are correct) is a more recently
developed mode and is used for many procedures.
Spiral
or helical scanning (both names are correct) is a more recently
developed mode and is used for many procedures.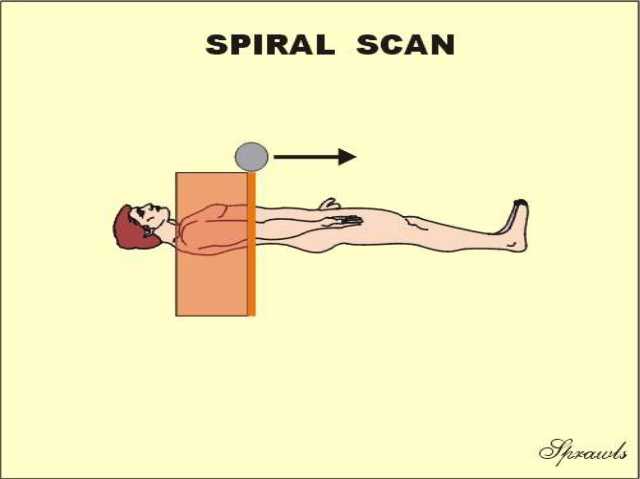 During
a spiral scan, the
body is actually moved through the x-ray beam.
During
a spiral scan, the
body is actually moved through the x-ray beam.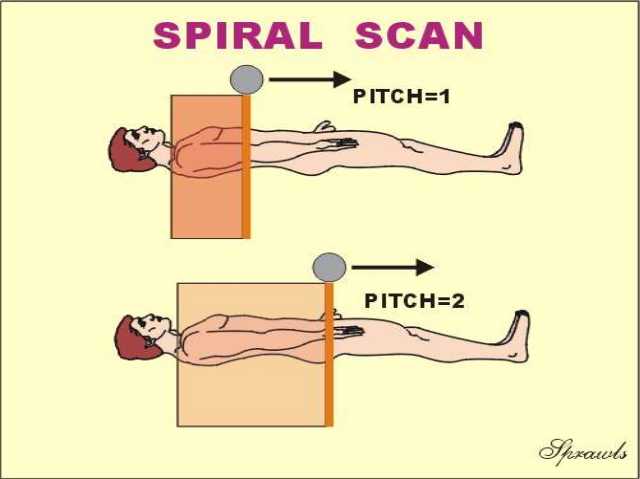 As
we see here, when the pitch is increased,
the x-ray beam appears to move faster along
the patient's body.
As
we see here, when the pitch is increased,
the x-ray beam appears to move faster along
the patient's body.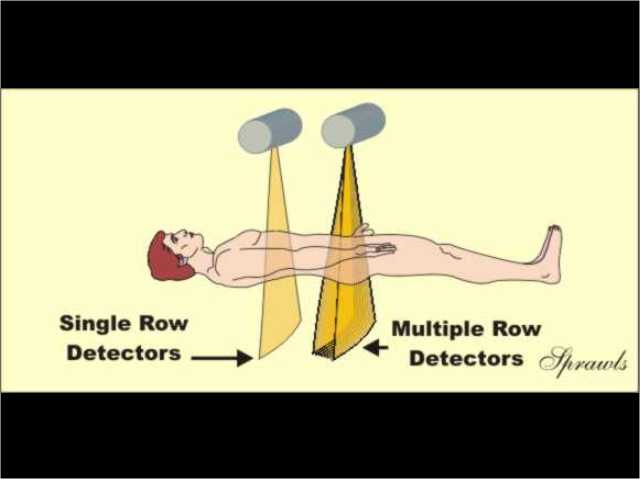 The
radiation detectors are very small elements (individual
detectors) that are arranged in rows that
span and intercept one view.
The
radiation detectors are very small elements (individual
detectors) that are arranged in rows that
span and intercept one view.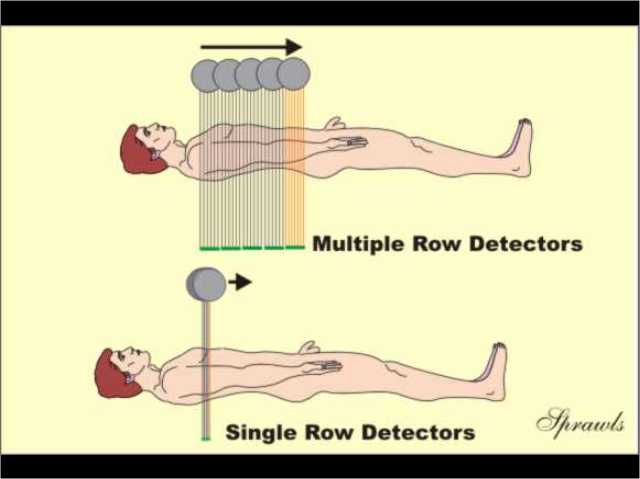 A
body section can generally be scanned faster
with a multiple row detector system because
there are multiple fan beams scanning simultaneously.
A
body section can generally be scanned faster
with a multiple row detector system because
there are multiple fan beams scanning simultaneously.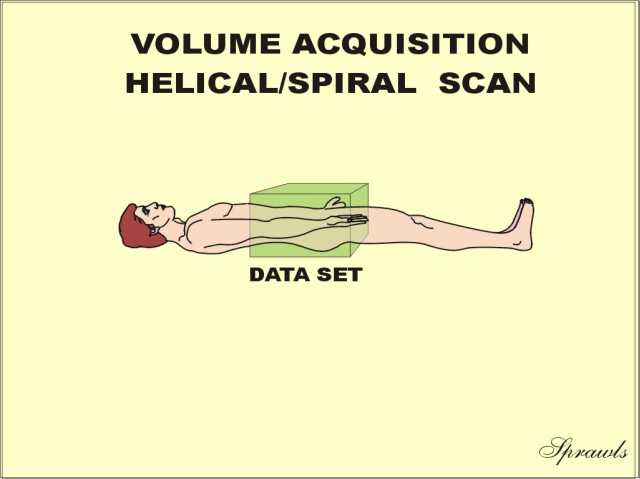 A
major advantage of spiral/helical scanning
it that it produces a continuous data set
extending over some volume of the patient's body.
A
major advantage of spiral/helical scanning
it that it produces a continuous data set
extending over some volume of the patient's body.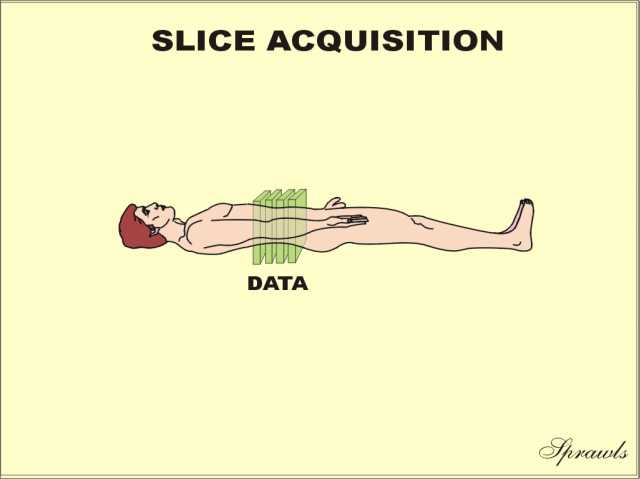 The
scan and step slice acquisition method produces data sets that
are fixed to specific slices of tissue.
The
scan and step slice acquisition method produces data sets that
are fixed to specific slices of tissue.
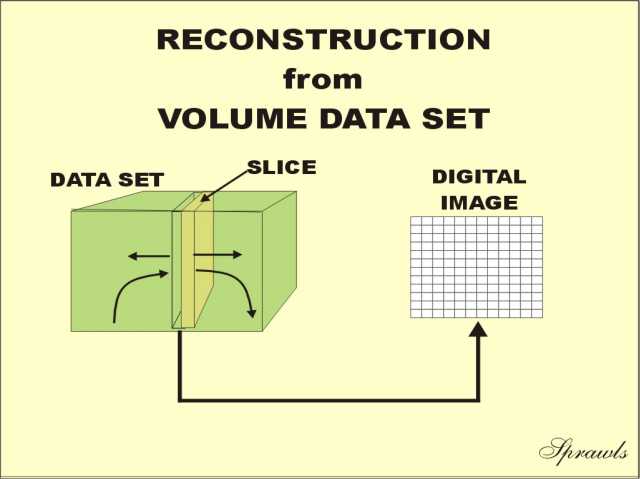 A
major advantage of spiral scanning is that the
thickness, position, and orientation of image slices
can be adjusted during the reconstruction phase.
A
major advantage of spiral scanning is that the
thickness, position, and orientation of image slices
can be adjusted during the reconstruction phase. A
volume data set can be used to
reconstruct 3-D images.
A
volume data set can be used to
reconstruct 3-D images.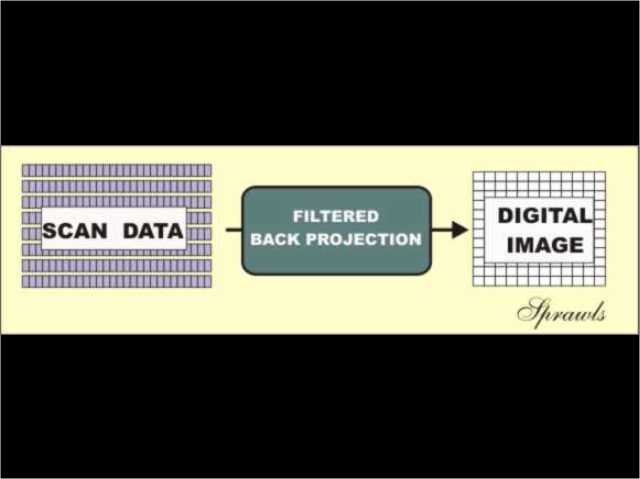 Image
reconstruction is the phase in which the
scan data set is
processed to produce an image. The image is digital and
consist of a matrix of pixels.
Image
reconstruction is the phase in which the
scan data set is
processed to produce an image. The image is digital and
consist of a matrix of pixels.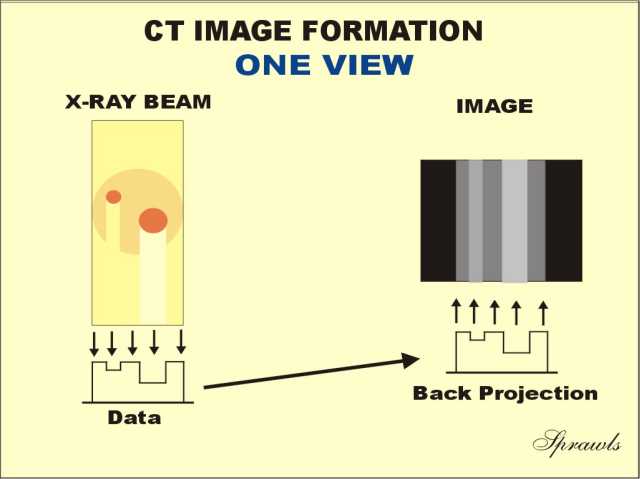
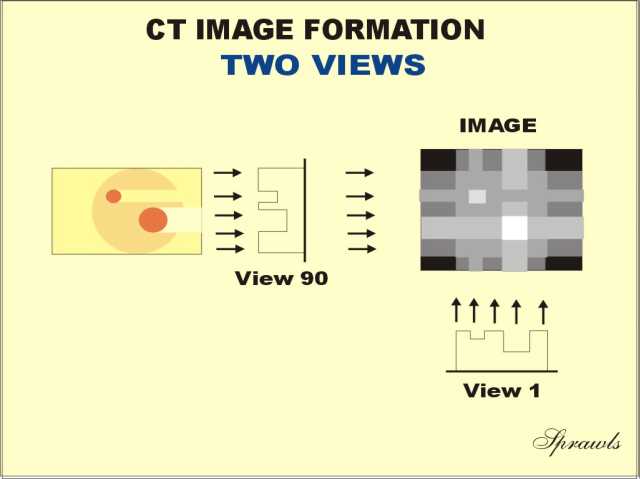 We
have now rotated the x-ray beam around the body by 900
and obtained another view.
We
have now rotated the x-ray beam around the body by 900
and obtained another view.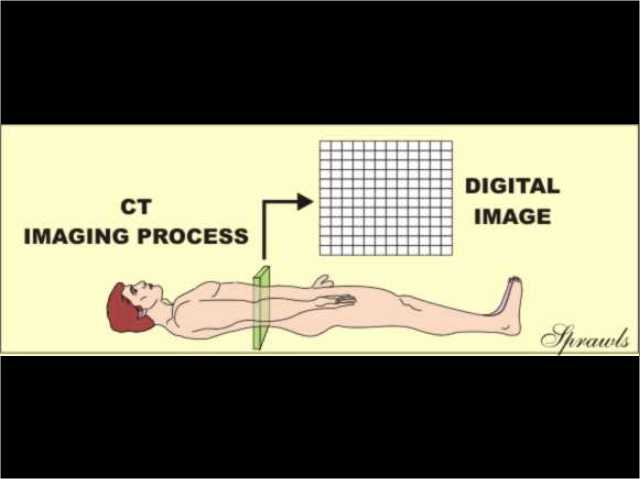 As
we have already discovered, the CT image is a digital in the form of a
matrix of pixels.
As
we have already discovered, the CT image is a digital in the form of a
matrix of pixels.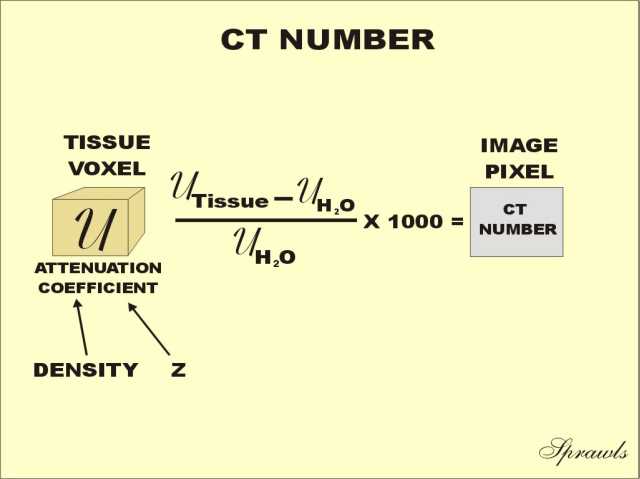 Here
we see the formula used in the reconstruction process to
calculate the CT numbers.
Here
we see the formula used in the reconstruction process to
calculate the CT numbers. The
CT image is, for all practical purposes, an image of the densities of
the tissue.
The
CT image is, for all practical purposes, an image of the densities of
the tissue. We
have now observed two of the three phases
of the CT imaging process.
We
have now observed two of the three phases
of the CT imaging process.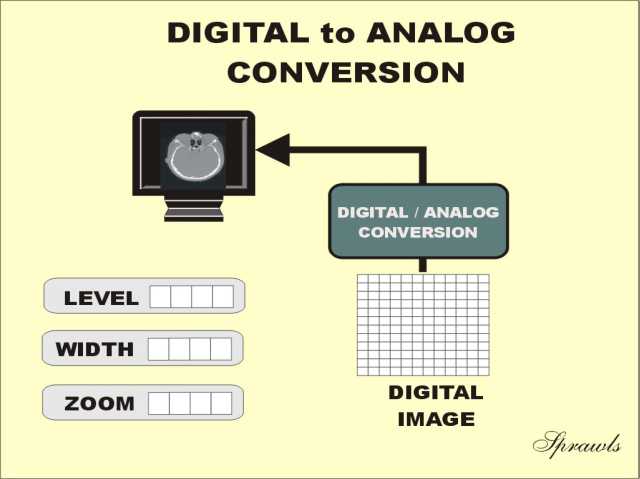 In
this phase the digital image, consisting of a
matrix of pixels with each pixel having a CT number, is converted
into a visible image represented by different
shades of gray or brightness levels.
In
this phase the digital image, consisting of a
matrix of pixels with each pixel having a CT number, is converted
into a visible image represented by different
shades of gray or brightness levels.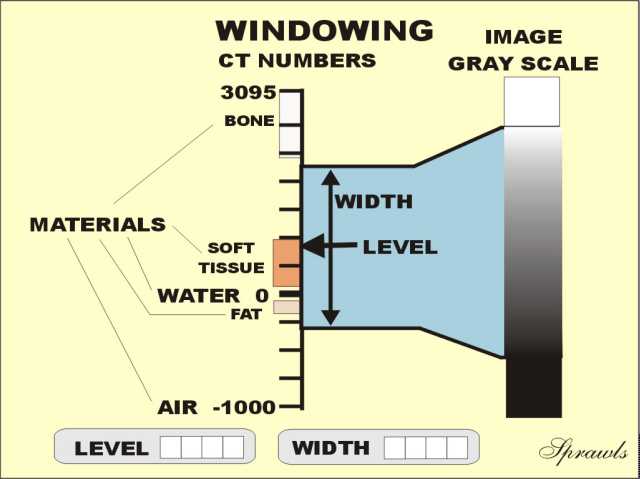 The
window is the range
of CT numbers that will be displayed with the different shades of
gray, ranging from black to white.
The
window is the range
of CT numbers that will be displayed with the different shades of
gray, ranging from black to white.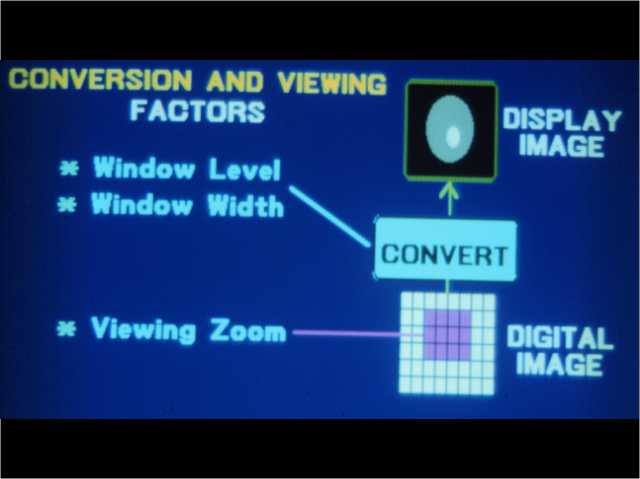 Zooming
is the process of selecting some smaller area
within the total digital image to cover the
full display.
Zooming
is the process of selecting some smaller area
within the total digital image to cover the
full display.