|
|
|
CONTENTS |
|
An important characteristic of any medical imaging method is its ability to show the anatomical detail of the human body. Detail, as used here, refers to the small structures, features, and objects associated with normal anatomy and various pathological conditions. The smallest detail that can be visualized is determined, to a large extent, by the amount of blur produced by the imaging procedure. There is some blur in all medical images. Some methods, however, produce images with significantly less blur than others, and the result is images that show much greater detail. Each imaging method also has certain associated factors that control the amount of blurring and the ultimate visibility of detail.
In this section we consider the general characteristics of image blur and its relationship to other image characteristics.
|
|
|
|
CONTENTS |
|
Blurring is present, to some extent, in all imaging processes, including
vision, photography, and medical imaging methods. The basic concept of
blur is illustrated in the following figure. An image is a visual
representation of a specific physical object, such as a patient's body. In
an ideal situation, each small point within the object would be
represented by a small, well-defined point within the image. In reality,
the "image" of each object point is spread, or blurred, within the image.
Blur
Size
The amount of blurring can be
expressed as the dimension of the blurred image of a very small object
point. Blur values range from approximately 0.15 mm, for mammography, to
approximately 15 mm, for imaging with a gamma camera.
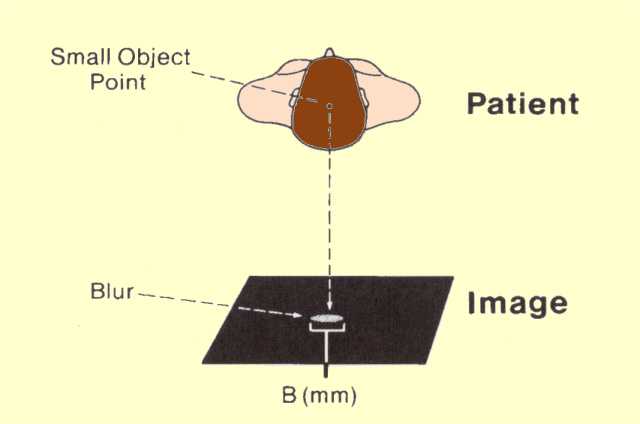
The Blur of an Individual Object Point
Blur Shape
The blur of a small object point can have a variety of shapes, as shown
below. The shape generally depends on the source of blur. Some x-ray system components, such as intensifying screens and image intensifier tubes, generally produce round blur patterns. Most imaging methods that produce digital images (digital
radiography and fluoroscopy, CT, MRI, etc.) produce square or 3D blur patterns that correspond to the dimensions of the image pixel or tissue voxel. Motion during the imaging process typically produces an elongated blur pattern. X-ray tube focal spots produce a variety of blur shapes.
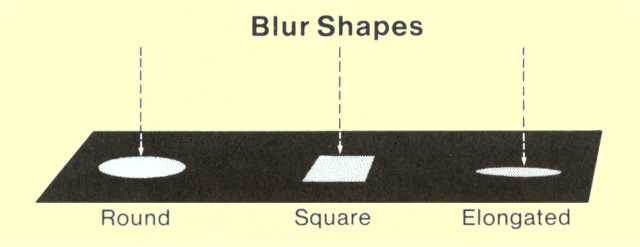
Blur Shapes Encountered in Medical Imaging
Blur
Profile
In addition to a size and shape, the blur produced by a specific factor has a specific intensity distribution
or profile. This characteristic is related to the manner in which the
point image is spread, or distributed, within the blur area. Two blur
distribution patterns are illustrated in the figure below. The actual
distribution of the image intensity within the blur area is often
illustrated by means of an intensity profile. Some sources of blur
uniformly distribute the object-point image intensity within the blur
area. This gives the blur pattern a precise dimension, as shown below.
Many sources of blur, however, do not uniformly distribute blur. Common
examples are intensifying screens and defocused optical systems. A common
distribution pattern is one with a relatively high intensity near the
center with a gradual reduction of intensity toward the periphery. The
profile of this type of distribution is often a Gaussian curve, as
illustrated.
Equivalent Blur
The full dimension (diameter)
of a Gaussian blur pattern is not used to express the amount of blur
because it would tend to overstate the blur in relation to blur that is
uniformly distributed. A more appropriate value is the dimension of a
uniform distribution that would produce the same general image quality as
the Gaussian distribution. This is designated the equivalent blur value.
For example, the two blur patterns shown below have the same general
effect on image quality even though the total dimension of the Gaussian
distribution is larger.
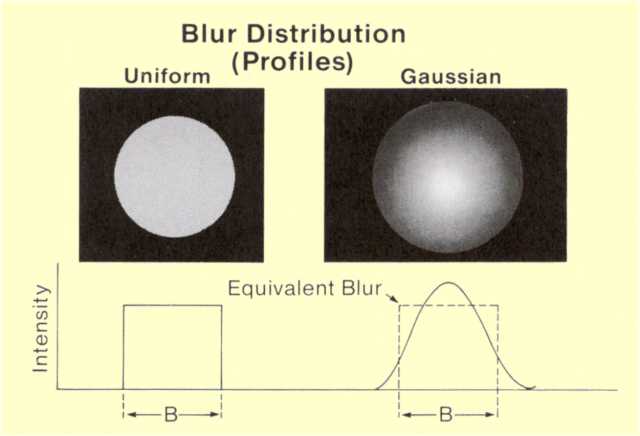
Blur Distribution Patterns
|
|
|
|
CONTENTS |
|
The most significant effect of blur in a medical imaging process is that it reduces the visibility of details such as small objects and structures. In every imaging process, blur places a definite limit on the amount of detail (object smallness) that can be visualized.
The direct effect of blur is to reduce the contrast of small objects and features, as
shown below. In effect, blur spreads the image of small objects into the surrounding background area. As the image spreads, the contrast and visibility are reduced.
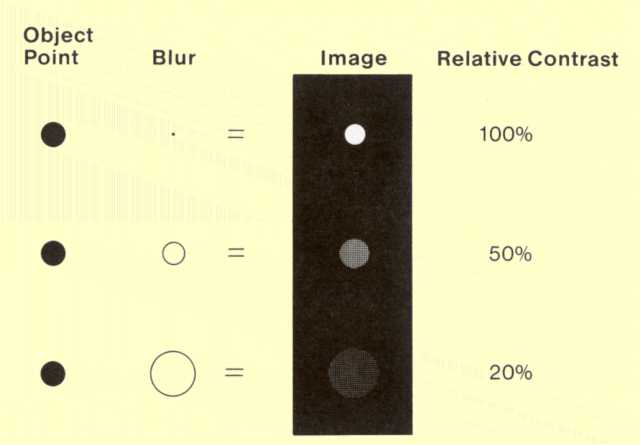
General Effect of Blur on Image Contrast
The visibility of specific objects is very dependent on the relationship between object size and the blur value. If the blur value is less than the dimension of an object, the reduced contrast will generally not affect visibility. When the amount of blur approaches the dimensions of the object, the blurring process can significantly reduce contrast. In some situations, especially in which small objects already have a low inherent contrast, the blur can significantly affect visibility. As a general rule, the blur value can be considered as an approximate detail-visibility threshold. In most situations, body structures much smaller than the blur value will not be visible.
The basic concept we need to emphasize is that the blur that is present as part of an imaging procedure reduces the contrast, and the resulting visibility, of small objects (detail) within the body. The extent to which the contrast is reduced depends on the relationship between the amount of blur and the size of the object, as illustrated in
the following figure. This diagram shows how the contrast of objects is affected by blur. The maximum value on the relative contrast scale (100%) represents the contrast of each object in the absence of blur; it does not mean that all objects, both small and large, have the same amount of inherent contrast. In projection x-ray imaging, small objects tend to produce much less contrast than large objects because of their increased penetration. The contrast and visibility of small objects are actually reduced by two factors: the increased x-ray penetration and the effects of blur, which we are considering here.
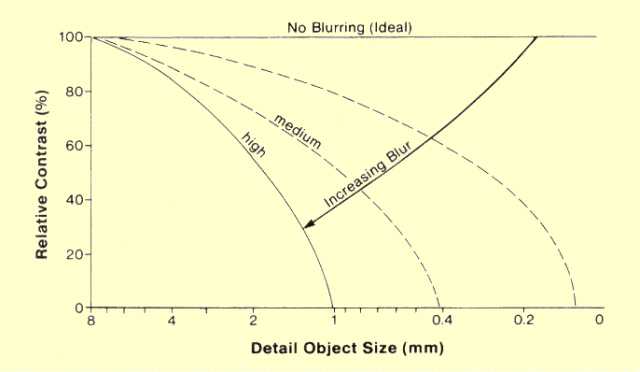
Effect of Blur on the Contrast of Objects of Different Size
No medical imaging method produces images that are free of blur; the no-blur line is included in the illustration as a point of reference. In this particular example, the blur values are described only in the relative terms of low, medium, and high.
Let us now consider the effect of a small amount of blur on the imaging process. The contrast of the larger objects is not affected. The loss of contrast because of blur increases with decreasing object size (detail). The contrast is eventually reduced to zero at some point along the detail scale, and no smaller objects will be visible. For objects that produce relatively low contrast, even without blur, the threshold of visibility might occur at object sizes larger than the point at which blur produces zero contrast. The visibility threshold is related to, but not necessarily equal to, the object size at which blur produces zero relative contrast.
As blur is increased in the imaging process, the loss of contrast increases for all objects, and the visibility threshold moves to the left.
|
|
|
|
CONTENTS |
|
An image that shows much detail and distinct boundaries is often described as being sharp. The presence of blur produces
unsharpness. Image unsharpness, as the term is commonly used, and blur refer to the same general image characteristic. In a more exact sense, however, image unsharpness is one of several visual effects produced by the basic process of blurring.
Unsharpness is especially noticeable at the boundaries and edges within an image.
In the early days of radiography, the term penumbra was often used to describe the
unsharpness, or blur, produced by x-ray tube focal spots. Penumbra is primarily an astronomical name for the unsharp shadow boundaries created by the moon because of its finite size. Because a number of different sources of blur in x-ray imaging produce the same visual effects and are not true penumbras, use of the term should be discouraged.
|
|
|
|
CONTENTS |
|
Resolution describes the ability of an imaging system to distinguish or separate (i.e., resolve) objects that are close together. The resolving capability of a particular imaging process is determined by the amount of blur. When blur is present, the images of individual objects begin to run
or blur together until the separate objects are no longer distinguishable. For objects to be resolved, their separation distance must be increased in proportion to the amount of blur present.
The resolving ability, or resolution, of an imaging system is relatively easy to measure and is often used to evaluate system blur.
The figure below shows one type of test object used for this purpose; it consists of parallel lead strips separated by a distance equal to the width of the strips. The common practice is to describe the line width and separation distance in terms of line pairs
(lp) per unit distance (millimeters or centimeters). One line pair consists of one lead strip and one adjacent separation space. The number of line pairs per millimeter is actually an expression of spatial frequency. As the lines get smaller and closer together, the spatial frequency (line pairs per millimeter) increases. A typical test pattern contains areas with different spatial frequencies. An imaging system is evaluated by imaging the test object and observing the highest spatial frequency (or minimum separation) at which the separation of the lines is visible.
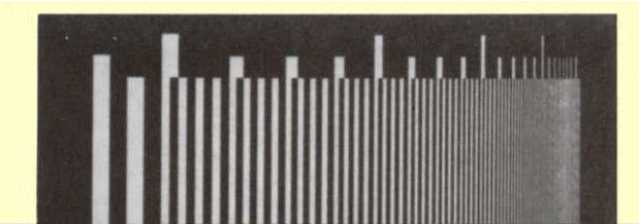
A Test Pattern Used to Measure the Resolution of an X-Ray Imaging System
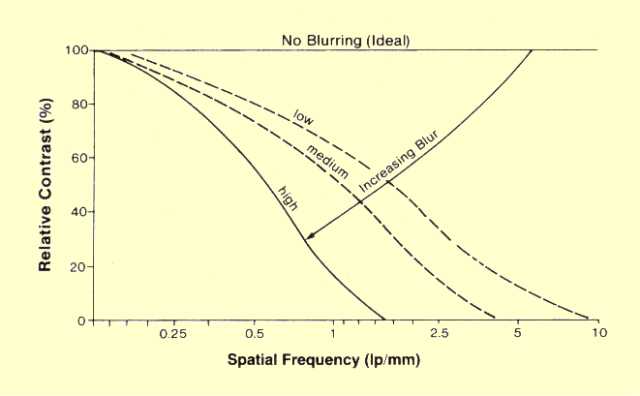
The figure below illustrates the effect of blur on resolution. When no blur is present, all of the line-pair groups can be resolved. As blur is increased, however, resolution is decreased, and only the lines with larger separation distances are visible.
Effect of Blur on Resolution
The three figures below compares how the contrast within the various line-pair groups is reduced by various levels of
blur (no blur, medium blur, and high blur). Note the similarity between this illustration and
the figure above titled, "A Test Pattern Used to Measure the
Resolution of an X-Ray Imaging System". Increasing spatial frequency corresponds to increasing image detail and reducing object size. Curves like those shown in
the following three figures are generally designated contrast transfer functions
(CTF). They show the ability of an imaging system to transfer contrast of objects of different sizes in the presence of blur.
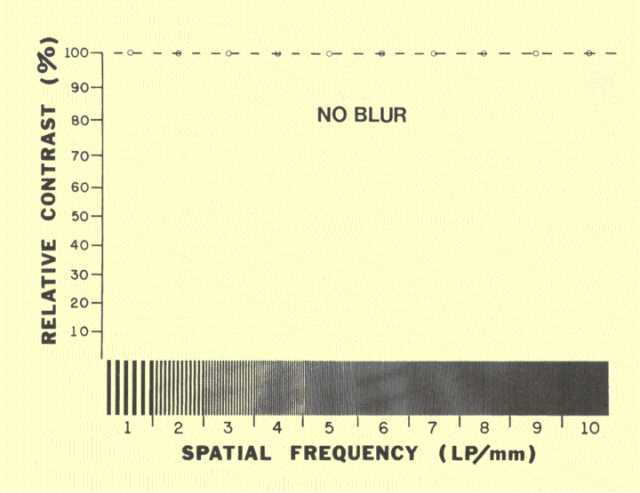
The General Relationship between Blur and Resolution - No Blur
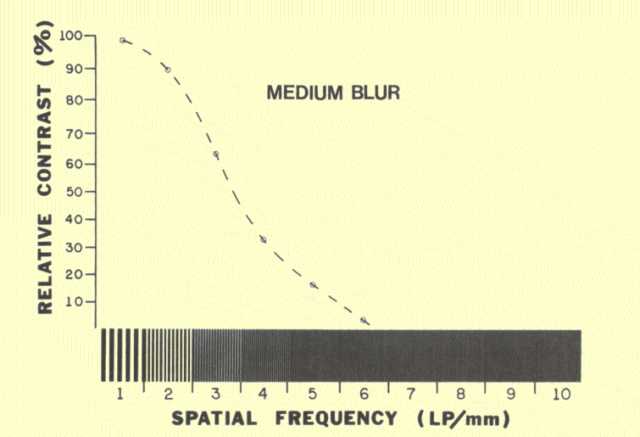
The General Relationship between Blur and Resolution - Medium Blur
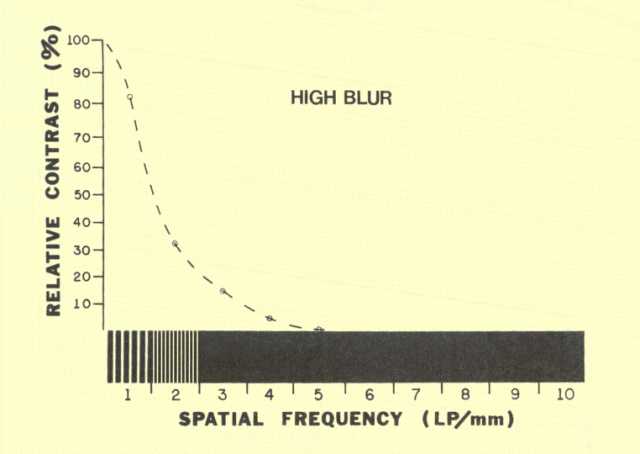
The General Relationship between Blur and Resolution - High Blur
The shape of the curve depends, to some extent, on the major source and distribution of blur within the system, as shown
below. For example, the typical CTF curve associated with focal spot blur
usually has a specific point at which the contrast becomes zero. This is
commonly referred to as the disappearance frequency and represents the
resolution limit, or resolving ability, of the system. When the major
source of blur is the receptor, i.e., the intensifying screen or image
intensifier tube, the curve might not show a distinct zero-contrast point.
Criteria must be established for defining the maximum resolution point.
Limiting Resolution
It is common practice to
specify the resolution of such a system in terms of the spacing frequency,
in line pairs per millimeter, at which the contrast falls to a relatively
low value, typically 3%. When comparing the resolution values of different
systems, this practice should be taken into consideration. For example, if
a manufacturer arbitrarily uses a 3% contrast, the resolution values for
its equipment will be higher than for equipment from a company that uses
10%, even if the systems are identical.
The advantage of using this method is that an imaging system or system
component can be described by a single numerical value, the so-called
limiting resolution.
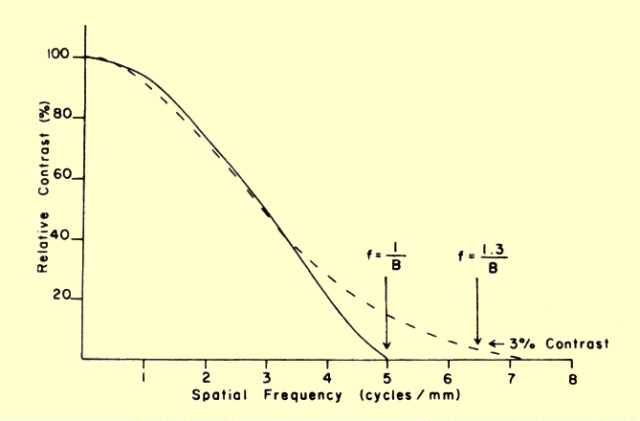
The Contrast Transfer Function Associated with Two Types of Blur. The Solid Line (
___ ) Is Characteristic of Motion and Focal Spot Blur. The Broken Line ( _ _ _ ) is Generally Characteristic of Receptor Blur.
Comparing
The Imaging Modalities
The approximate blur and resolution values encountered with various imaging methods are shown
below, which illustrates why some imaging methods are much better than others in visualizing anatomical detail.
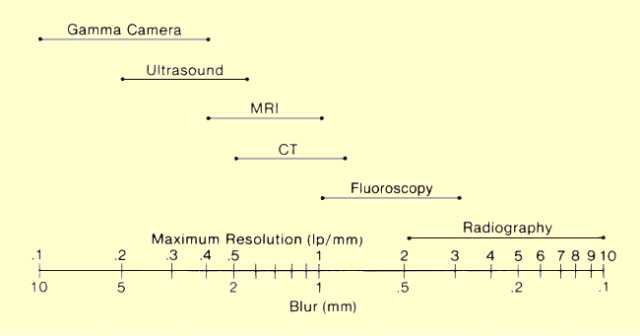
Comparison of Blur and Resolution Values for Different Imaging Methods
|
|
|
|
CONTENTS |
|
The modulation transfer function (MTF) is a graphical description of the blur, or resolution characteristics, of an imaging system or its individual components. In many respects, the MTF is similar to the CTF shown in
the figure below. The difference is that the CTF describes a system's ability to image line pairs, whereas the MTF describes its ability to image sine-wave shapes, or spatial frequencies. Rather than lines and spaces, as in the CTF test object, a true MTF test object has peaks and valleys. Actually, the MTF is seldom determined by using such a test object, but the idea is useful in understanding the concept of
MTF. One peak and valley make up 1 cycle of the object. Such a test object is characterized by its spatial frequency, which is the number of cycles (peaks and valleys) per millimeter of length. In other words, an MTF test object has a certain number of peaks and valleys (cycles) per millimeter, whereas a CTF test object has a certain number of lines and spaces (line pairs) per millimeter. The ability of a system to image the various spatial frequencies is related to the amount of blur present.
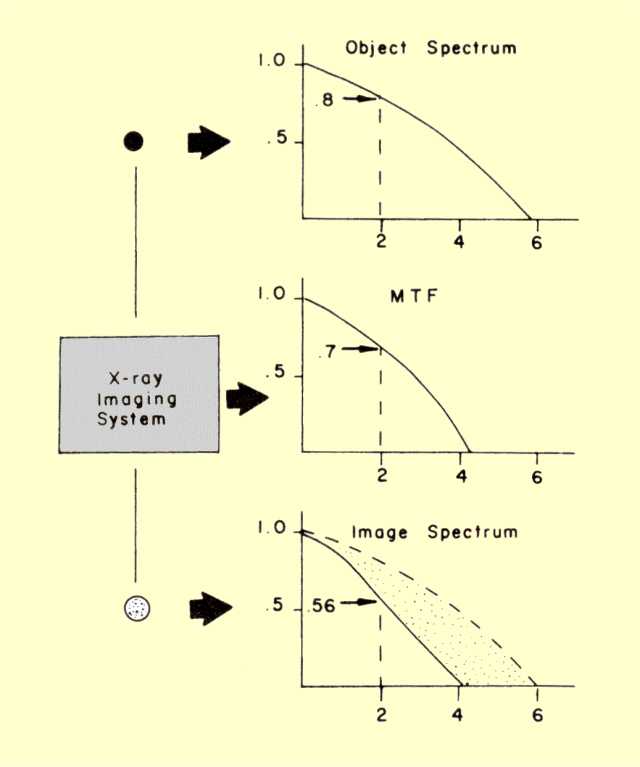
The Relationship of an Image Spatial Frequency Spectrum to the Object Spectrum and the MTF of the Imaging System
Spatial Frequency of
Anatomical Objects
A large object of relatively uniform thickness contains low frequency components. At the edge of such an object, however, high frequency components are created by the sudden change in thickness. Generally speaking, small objects of a given cross-sectional shape have higher frequency components than larger objects.
In the spatial frequency domain the anatomical structure of the human body
and signs of pathology and injury are represented by a wide range or
spectrum of frequencies.
Large objects are low-frequency objects and small objects contain high
frequencies.
In order to form an unblurred image of the object, the x-ray imaging
system must be able to produce sufficient contrast for all spatial
frequencies contained in the object. If some of the frequency components
are lost in the imaging process, the image will not be a true
representation of the object. For example, if the high frequency
components are not present in the image, the image will be blurred. The
spatial frequency content of the image that is displayed is determined by the frequency content of the object being imaged and the MTF of the imaging system. This is illustrated in
the figure above. The image content at a specific frequency is found by multiplying the object content by the
MTF. For example, in the figure above, the object contains 0.8 (80%) at a frequency of 2 cycles per mm. The MTF at this frequency is 0.7. Multiplying these two quantities shows that the image will contain only 0.56 (56%) at this frequency. The shaded area is the portion of the object's spatial frequency spectrum that is lost because of the MTF of the imaging system. Any frequency components of the object that are above the resolution limit of the system are completely lost. In effect, the MTF of the imaging system can cut out the higher frequency components associated with an object, and the image will be made up only of lower frequency components. Since low frequency components are associated with large objects with gradual changes in thickness, as opposed to sharp edges, the image will be blurred.
Composite MTF
A property of MTFs that is not possessed by CTFs is their ability to be cascaded. Consider an
imaging system in which the sources of blur are the focal spot and receptor. The blur characteristics of each of these can be described by an MTF curve, as shown
below. The composite MTF of the total system is found by multiplying the two MTF values at each frequency. For example, if at 2 cycles per mm the MTF for the focal spot is 62%, and for the receptor is 72%, the total system will have an MTF value of 44%. It should be observed that a system cannot have frequency components that are higher than the resolution limit of either the receptor or the focal spot. This is equivalent to saying that the total system blur cannot be less than the blur from either of the two sources. If the MTFs of the different blur sources (focal spot, motion, or receptor) are significantly different, the one with the lowest limiting frequency (the largest blur) will generally determine the MTF of the total system. In other words, if one source is producing significantly larger blur than the other sources, the total system blur will be essentially equal to the largest blur value.
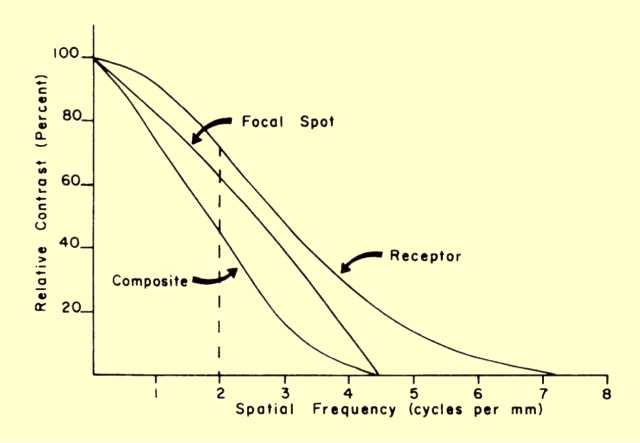
The Composite MTF
|
|