Welcome to the 2021 Spring Edition,
Our purpose is to provide educational articles
and news that are of specific interest and value to members of the
WNCIEE Section and residents of the community. Members are encouraged
to forward and share these with others, especially students, to show
some of the interesting innovations and developments in the fields of
electrical energy,
electronics, communications, and computer applications here in Western
North Carolina. .
Perry Sprawls, Editor. sprawls@emory.edu
Understanding Power Grids
Student Activities
From the Winter Edition
Officers for 2021
Understanding The Weather Models
Preserving Our History and Heritage
Bora Karayaka, Member Professional Profile
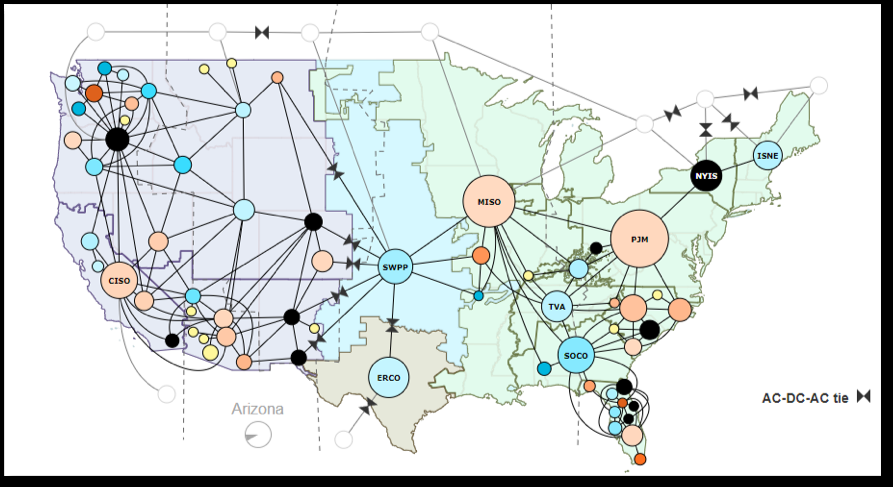
The organization of the electrical power system into grids has received considerable public attention recently because of the massive and extended weather related power outages, especially in the Southwest.
This is providing an opportunity for engineers to update their knowledge of the grid system and help others, especially students, have a better understanding of what the grid is and the role it plays in supplying reliable power to various communities. An excellent review is provided in
How The Grid Works

SoutheastCon 2021 Student Hardware Competition Report
For over 40 years IEEE
Region 3’s Southeastcon has hosted an annual student
hardware completion that has elements of design including computer
control,
electronic sensors, software programming and mechanical challenges to
overcome.
Southeastcon, as we know it today, started in with a conference 1971 in
Charlottesville VA that was actually the 9th Annual Region
Conference from IEEE R3’s
founding back in 1963[Ref:].
During the 1980s these student conferences each year began to be
called the "best ever hardware contest" and became a highly
acclaimed part of the student activities of the annual conference.
[Ref: https://ethw.org/IEEE_Region_3
_(Southeastern_U.S.)_History]
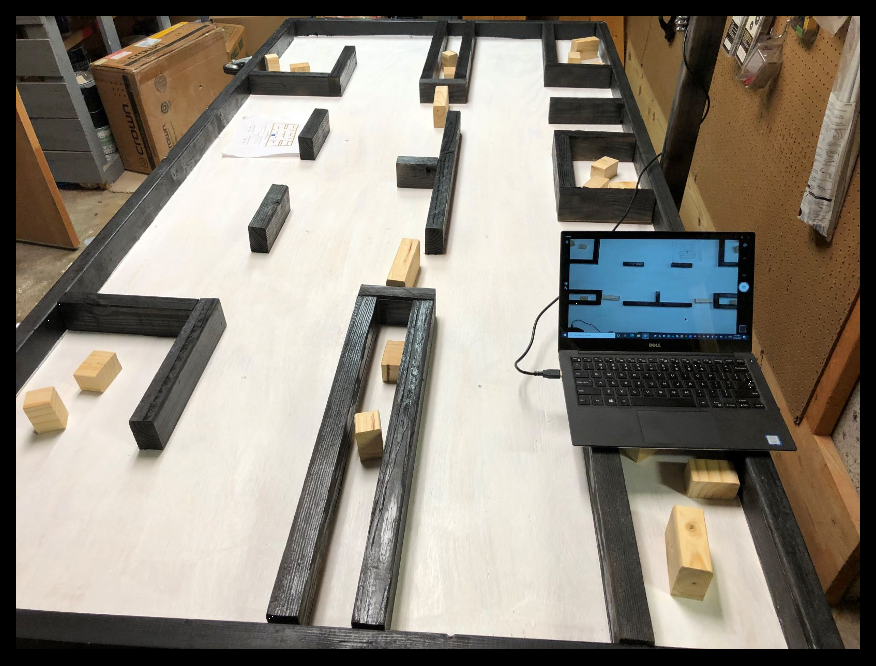
Photo 1. Detail of the layout of the PacMan Challenge for the 2021
Hardware Competition
This enthusiasm has continued into the 2020’s with this year’s event
called “Game On!”
that resurrects that old favorite classic arcade game of “Pacman” for
IEEE SoutheastCon
2021! Teams this year earned points by navigating the traditional 4x8
plywood sheet-based maze, collecting pellets, and avoiding ghosts. Of
course, this year the
competition was a little different as it was conducted remotely with Zoom
rooms,
with each team being isolated to their own lab at the respective
universities
that made it to the competition online:
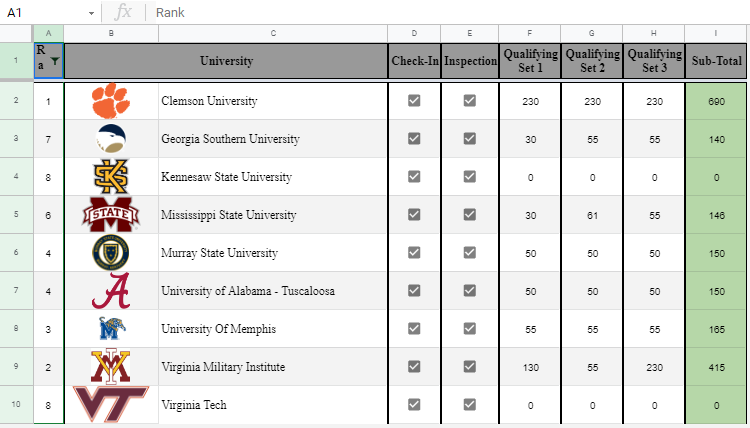
Photo 2. Final score sheet for the 9 teams that made it to the
competition rooms on Zoom
But the spirit of competition was still there at this year’s virtual
SoutheastCon 2021
as was seen with the beginnings at the Team Captain meeting in the Zoom
call
that occurred on Friday night, just as it was in 1981 when this
reporter was
a student participant from the University of Tennessee at that
time:
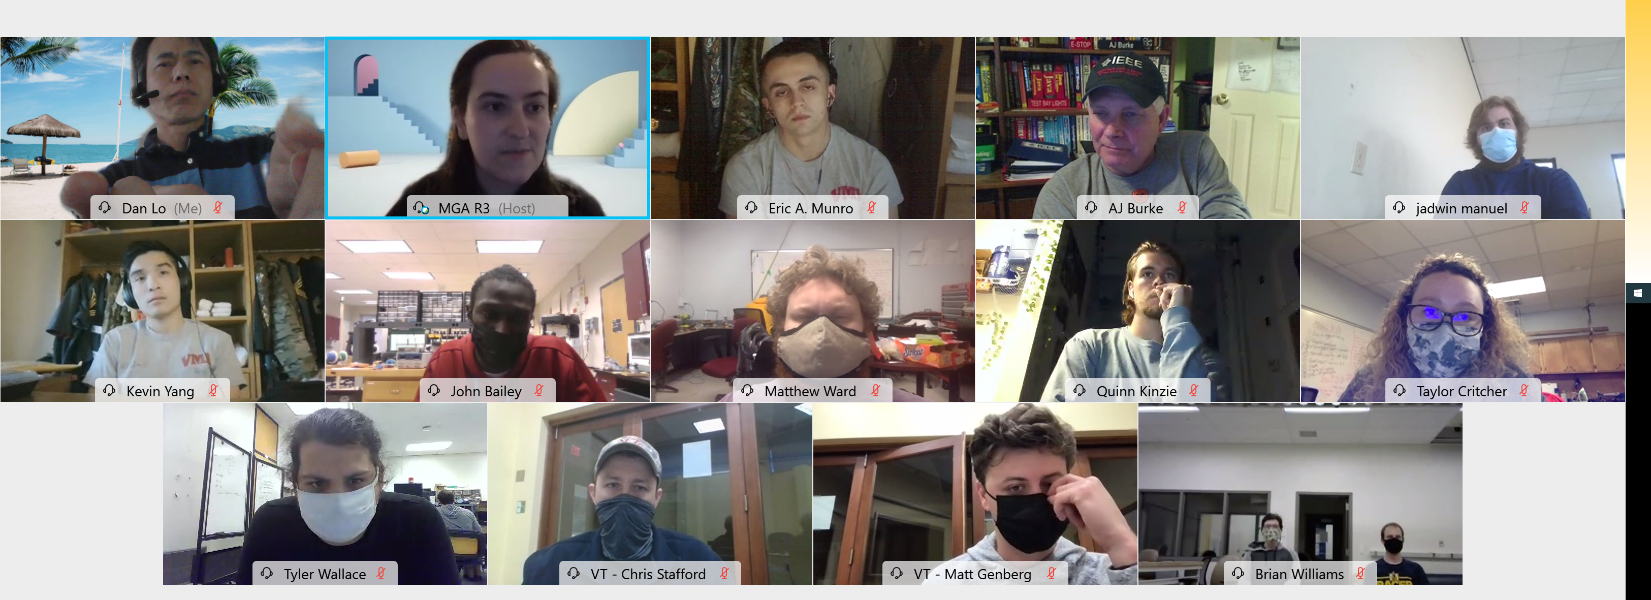
Photo 3. The Friday night “Team Captains” meeting for final questions
and changes.
Congratulations to this year’s winning team from Clemson University and
we are
looking forward to seeing all the teams back in Mobile Alabama for
SoutheastCon 2022,
but we hope to be back in-person for the Spring of next year!
AJ Burke, IEEE WNC Secretary
WNC section Chair:
Jeff Bevan ;
jeff_bevan@ieee.org
WNC section
Vice-Chair: Brian Kowald; bkowald@iee.org
WNC section
Secretary: AJ Burke;
ajburke@ieee.org
WNC section
Treasurer: Bill Barkley; bill.barkley@ieee.org
WNC section Power &
Energy Society Chair: Bora Karayaka; hbkarayaka@wcu.edu
WNC section Power &
Energy Society Vice-Chair: Bob Pettigrew;
robpet50@ieee.org
WNC section
Consultants Network Chair: Charles Lord;
c.j.lord@ieee.org
WNC section Consultants Network Vice-Chair: AJ Burke; ajburke@ieee.org
 |
 |
| Current Weather Observations | Forecast for Future Weather from Models |
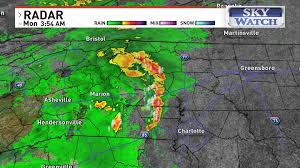
Most of us begin and end our days with the TV or phone apps "checking the weather." Modern science and technology can now provide us with reports on current weather conditions and forecast for the future with accuracies of just a few degrees and minutes for any location in the country. The easy to understand maps, graphics, and data presented to us are based on a highly complex technological system that collects and feeds data into mathematical models that are used to forecast upcoming weather.
Our interest here is specifically on the
models
that are used to produce
 forecasts.
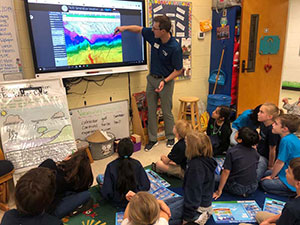
WLOS News
13 Chief Meteorologist Jason Boyer is a major contributor to this
article. Jason
was
inspired by one of his middle school teachers to pursue the sciences,
and one of his efforts now is to do the same by sharing his excitement
for the science of weather with young students in local schools, as
shown here.
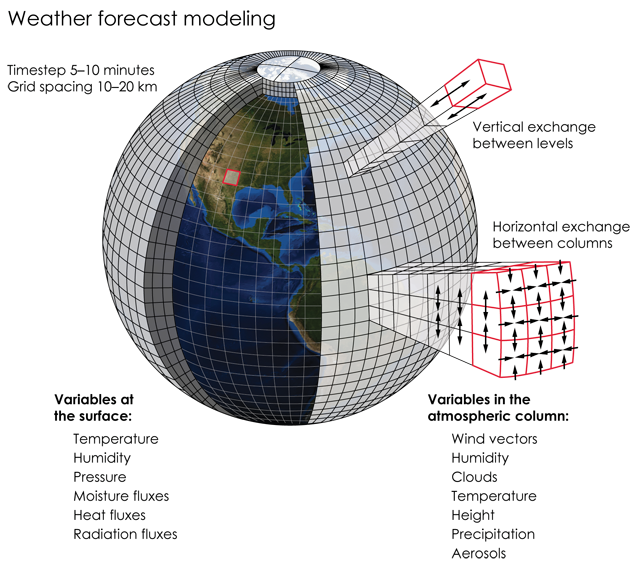
The models are mathematical equations
based on physics that characterize how the air moves and heat and
moisture are exchanged in the atmosphere. Weather observations
(pressure, wind, temperature and moisture) obtained from ground and
upper atmospheric sensors are fed into these equations. The observations
are brought into the models in a process known as data assimilation.
forecasts.
WLOS News
13 Chief Meteorologist Jason Boyer is a major contributor to this
article. Jason
was
inspired by one of his middle school teachers to pursue the sciences,
and one of his efforts now is to do the same by sharing his excitement
for the science of weather with young students in local schools, as
shown here.
The models are mathematical equations
based on physics that characterize how the air moves and heat and
moisture are exchanged in the atmosphere. Weather observations
(pressure, wind, temperature and moisture) obtained from ground and
upper atmospheric sensors are fed into these equations. The observations
are brought into the models in a process known as data assimilation.
Forecasters generally identify the models they are using.
The data which
weather models use is nearly the same. Temperature, wind, pressure and
humidity are the key components to initializing all weather models.
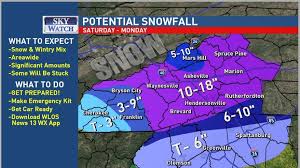
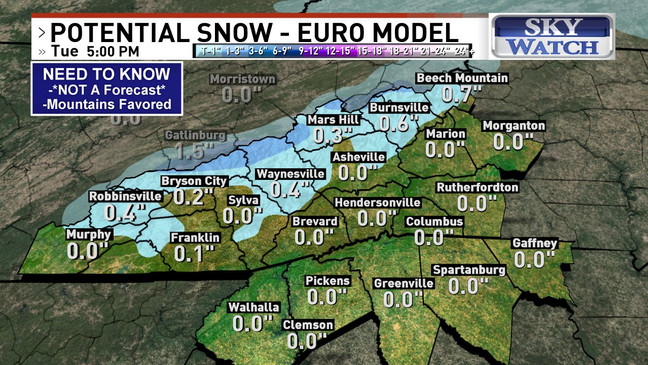
There are two groups of models that weather
forecasters and atmospheric scientists utilize. The American models
(NAM, RAP, HRRR, GFS) and the European or EURO models (ECMWF & UKMET).
N.O.A.A. produces the NAM, RAP, HRRR & GFS
models. Each model uses a different grid or resolution to sample for its
eventual forecast output.
For instance, the NAM model is run at 3km & 12km
grid resolutions--meaning a 3D sample of the atmospheric conditions over
a 3km x 3km x 3km volume, or a 12km x 12km x 12km volume, spread out
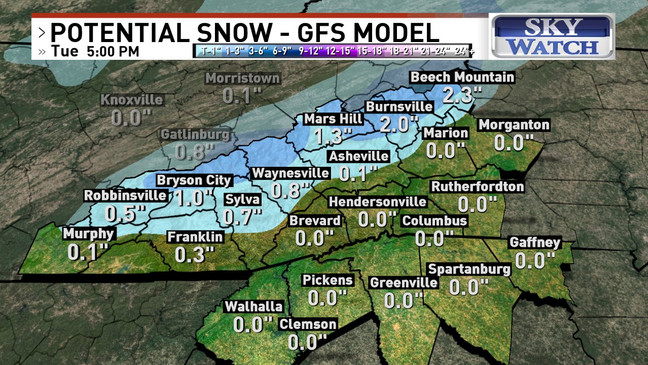
over the Continental U.S. is used, while the GFS & European models are
global-scale. The GFS’s resolution is based on a 25km grid, while the
European’s is 9km.
Within these grids, weather data is collected
from 1000s of different locations, usually airports, where automated
systems continuously measure atmospheric conditions near the ground.
Other “missing” data is created to fill in the gaps.
Upper-level data is collected from high-altitude
balloons launched twice per day at various National Weather Service
offices, and also from airplanes.
Weather models are limited by computing power.
As computational power increases, weather models will be able to
initialize with more and more data over smaller and smaller spatial and
temporal scales. This, (in theory) should lead to more accurate
forecasts for more locations, more often.
Where models differ and why some are better at
forecasting in certain situations than others can be found in how they
take the initial data and process it to create a forecast.
The NAM, RAP & HRRR are better at
shorter-range forecasts. The HRRR forecasts a maximum of 36 hours from
initialization, while the NAM 3km puts out a forecast up to 60 hours
from its initialization. The GFS forecasts up to 384 hours or 16 days!
We can think of the models used by meteorologists as being like equations used by engineers to solve complex problems. They are the tools used by the highly educated and experienced meteorologists along with their creativity to provide us with "the weather" to guide our daily activities, and beyond.
For well over half of the 20th Century, the vacuum tube was
the major element in most electronic devices including radios,
television, audio systems, and early computers. The first electronic
tube developed in 1904
by English physicist John Ambrose Fleming consisted of two
electrodes, a cathode (filament) and anode (plate).
The cathode was an electrically heated filament that could emit
electrons by the process of thermionic emission. When a voltage was
applied between the filament and plate current would flow through the
vacuum. This was a diode and could be used as a rectifier. In 1907,
American inventor Lee de Forest added a third electrode creating the
first triode tube. This third electrode, called the control grid,
enabled the vacuum tube to be used not just as a rectifier, but as an
amplifier of electrical signals.
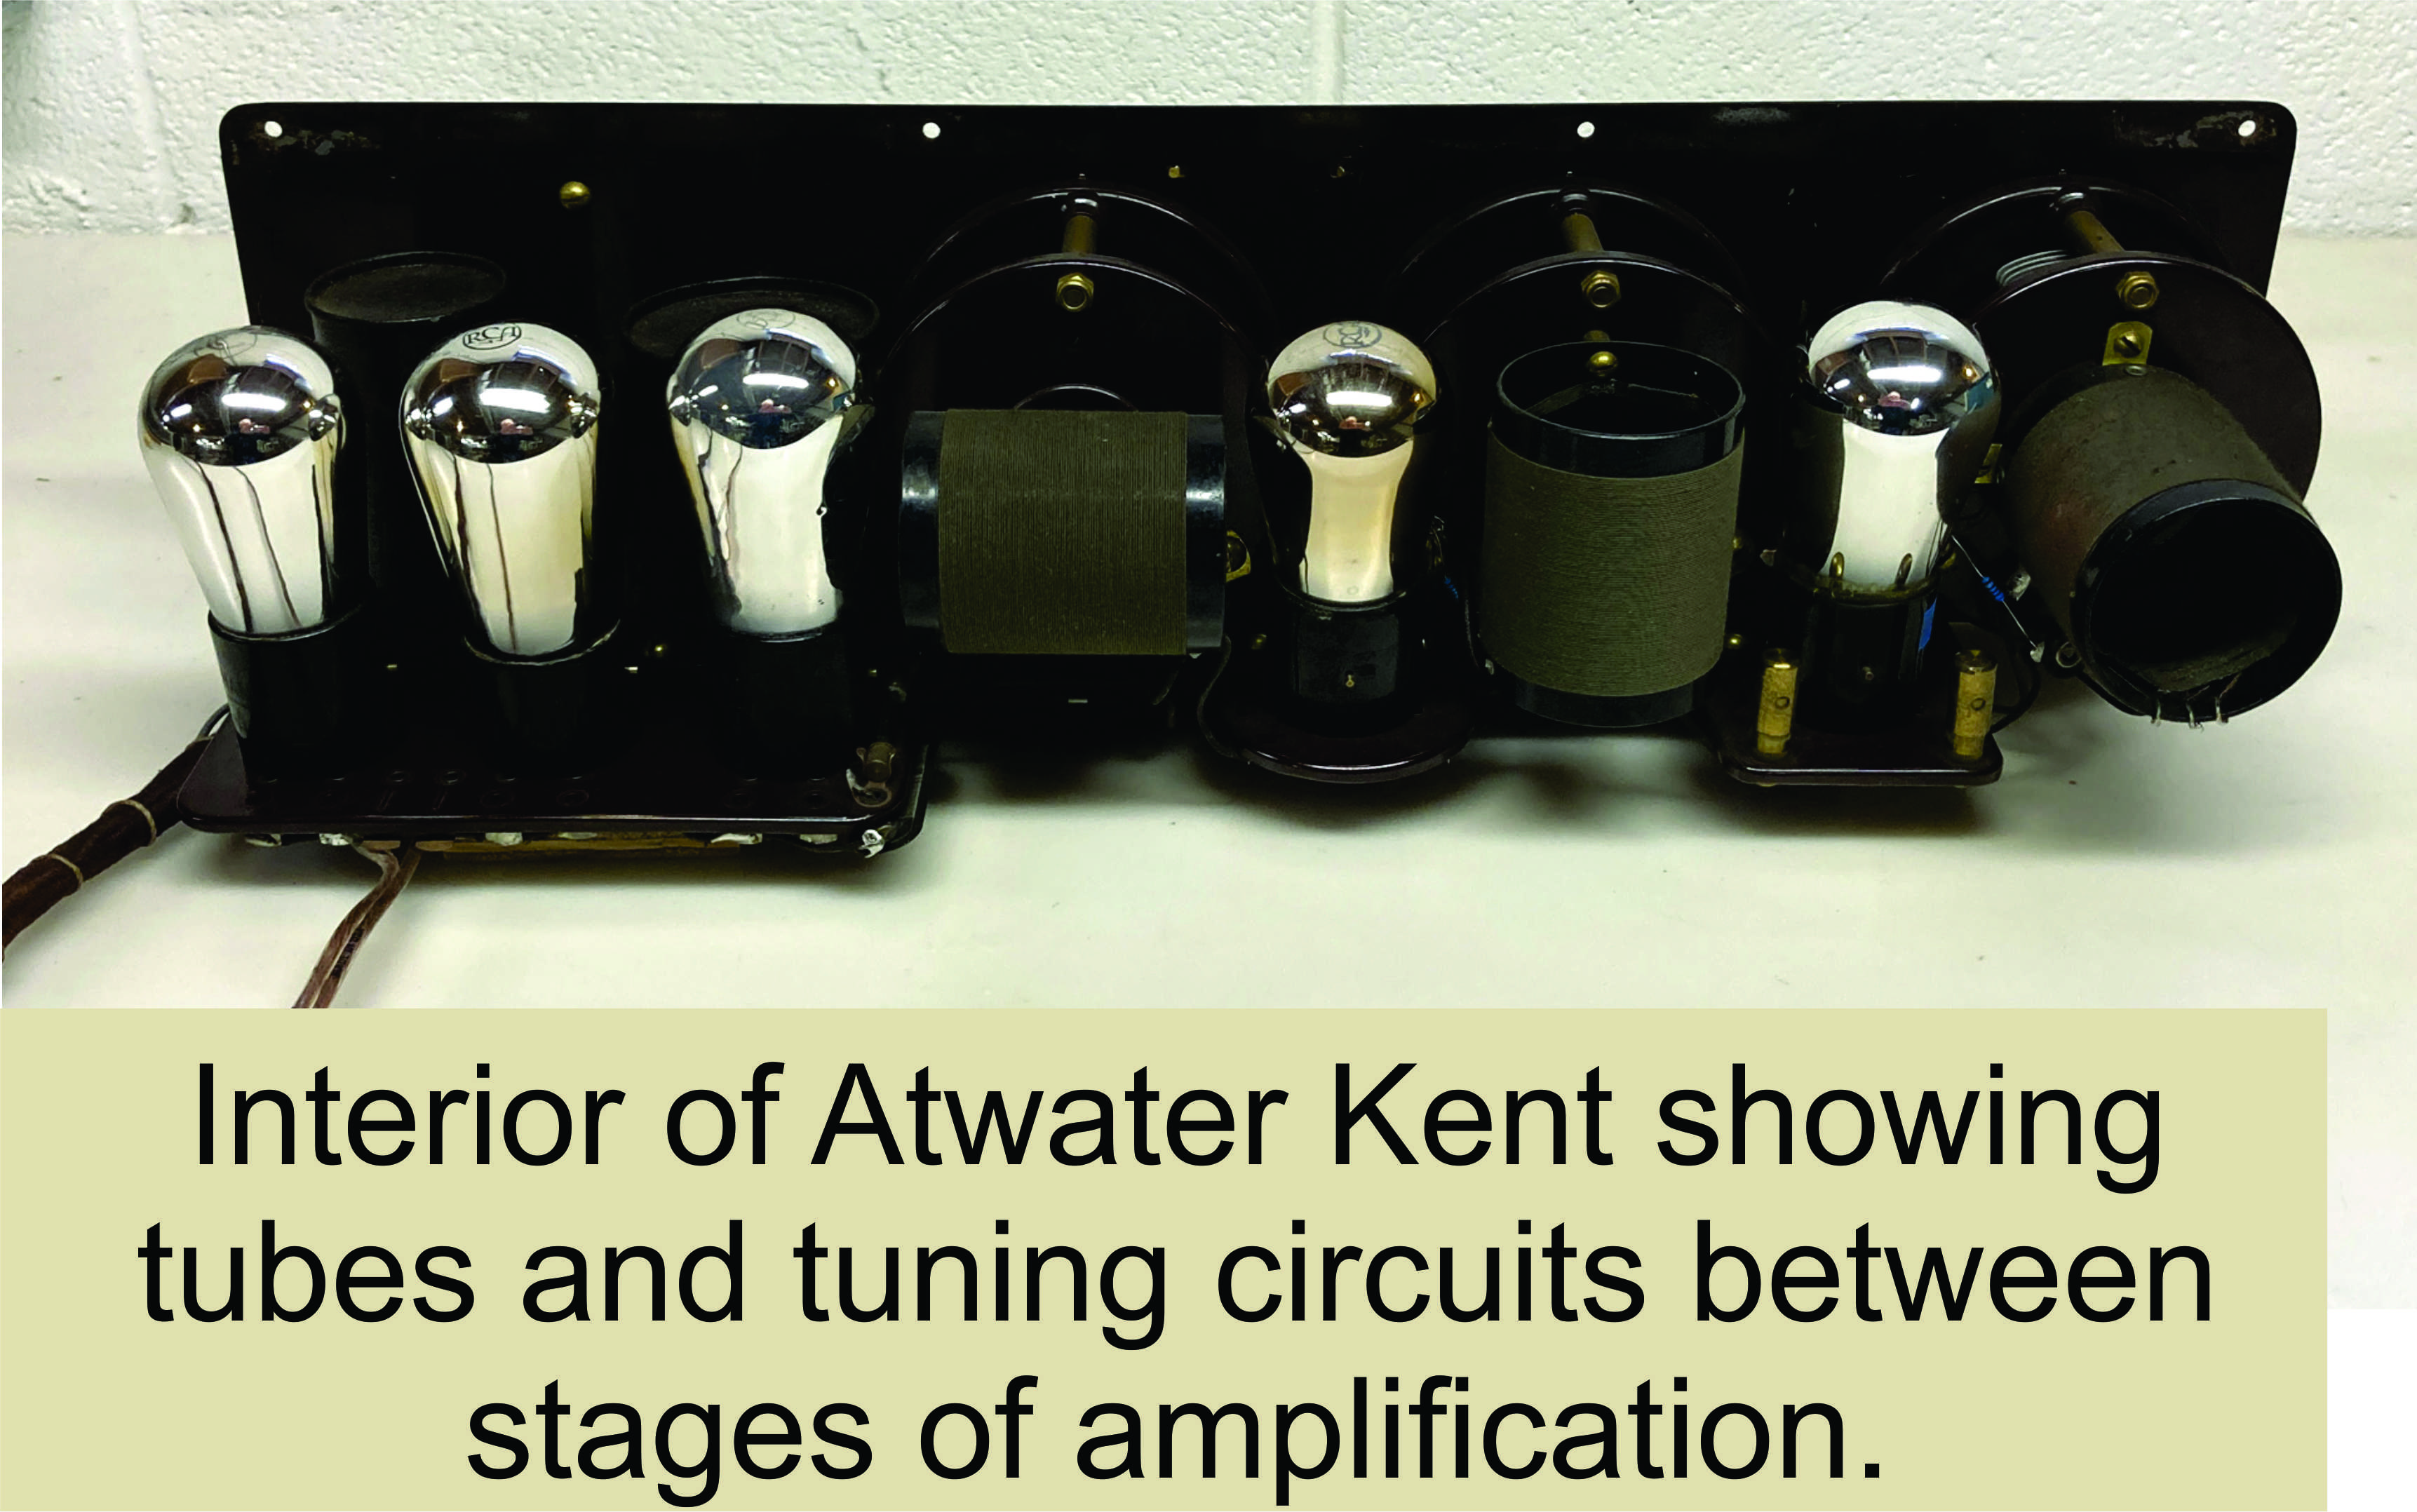
This led to the development of radios that
consisted of several tubes performing functions including rectification,
RF signal detection, and amplification of both RF and audio signals.
These were the radios that were used for the half century up to
developments using transistors.
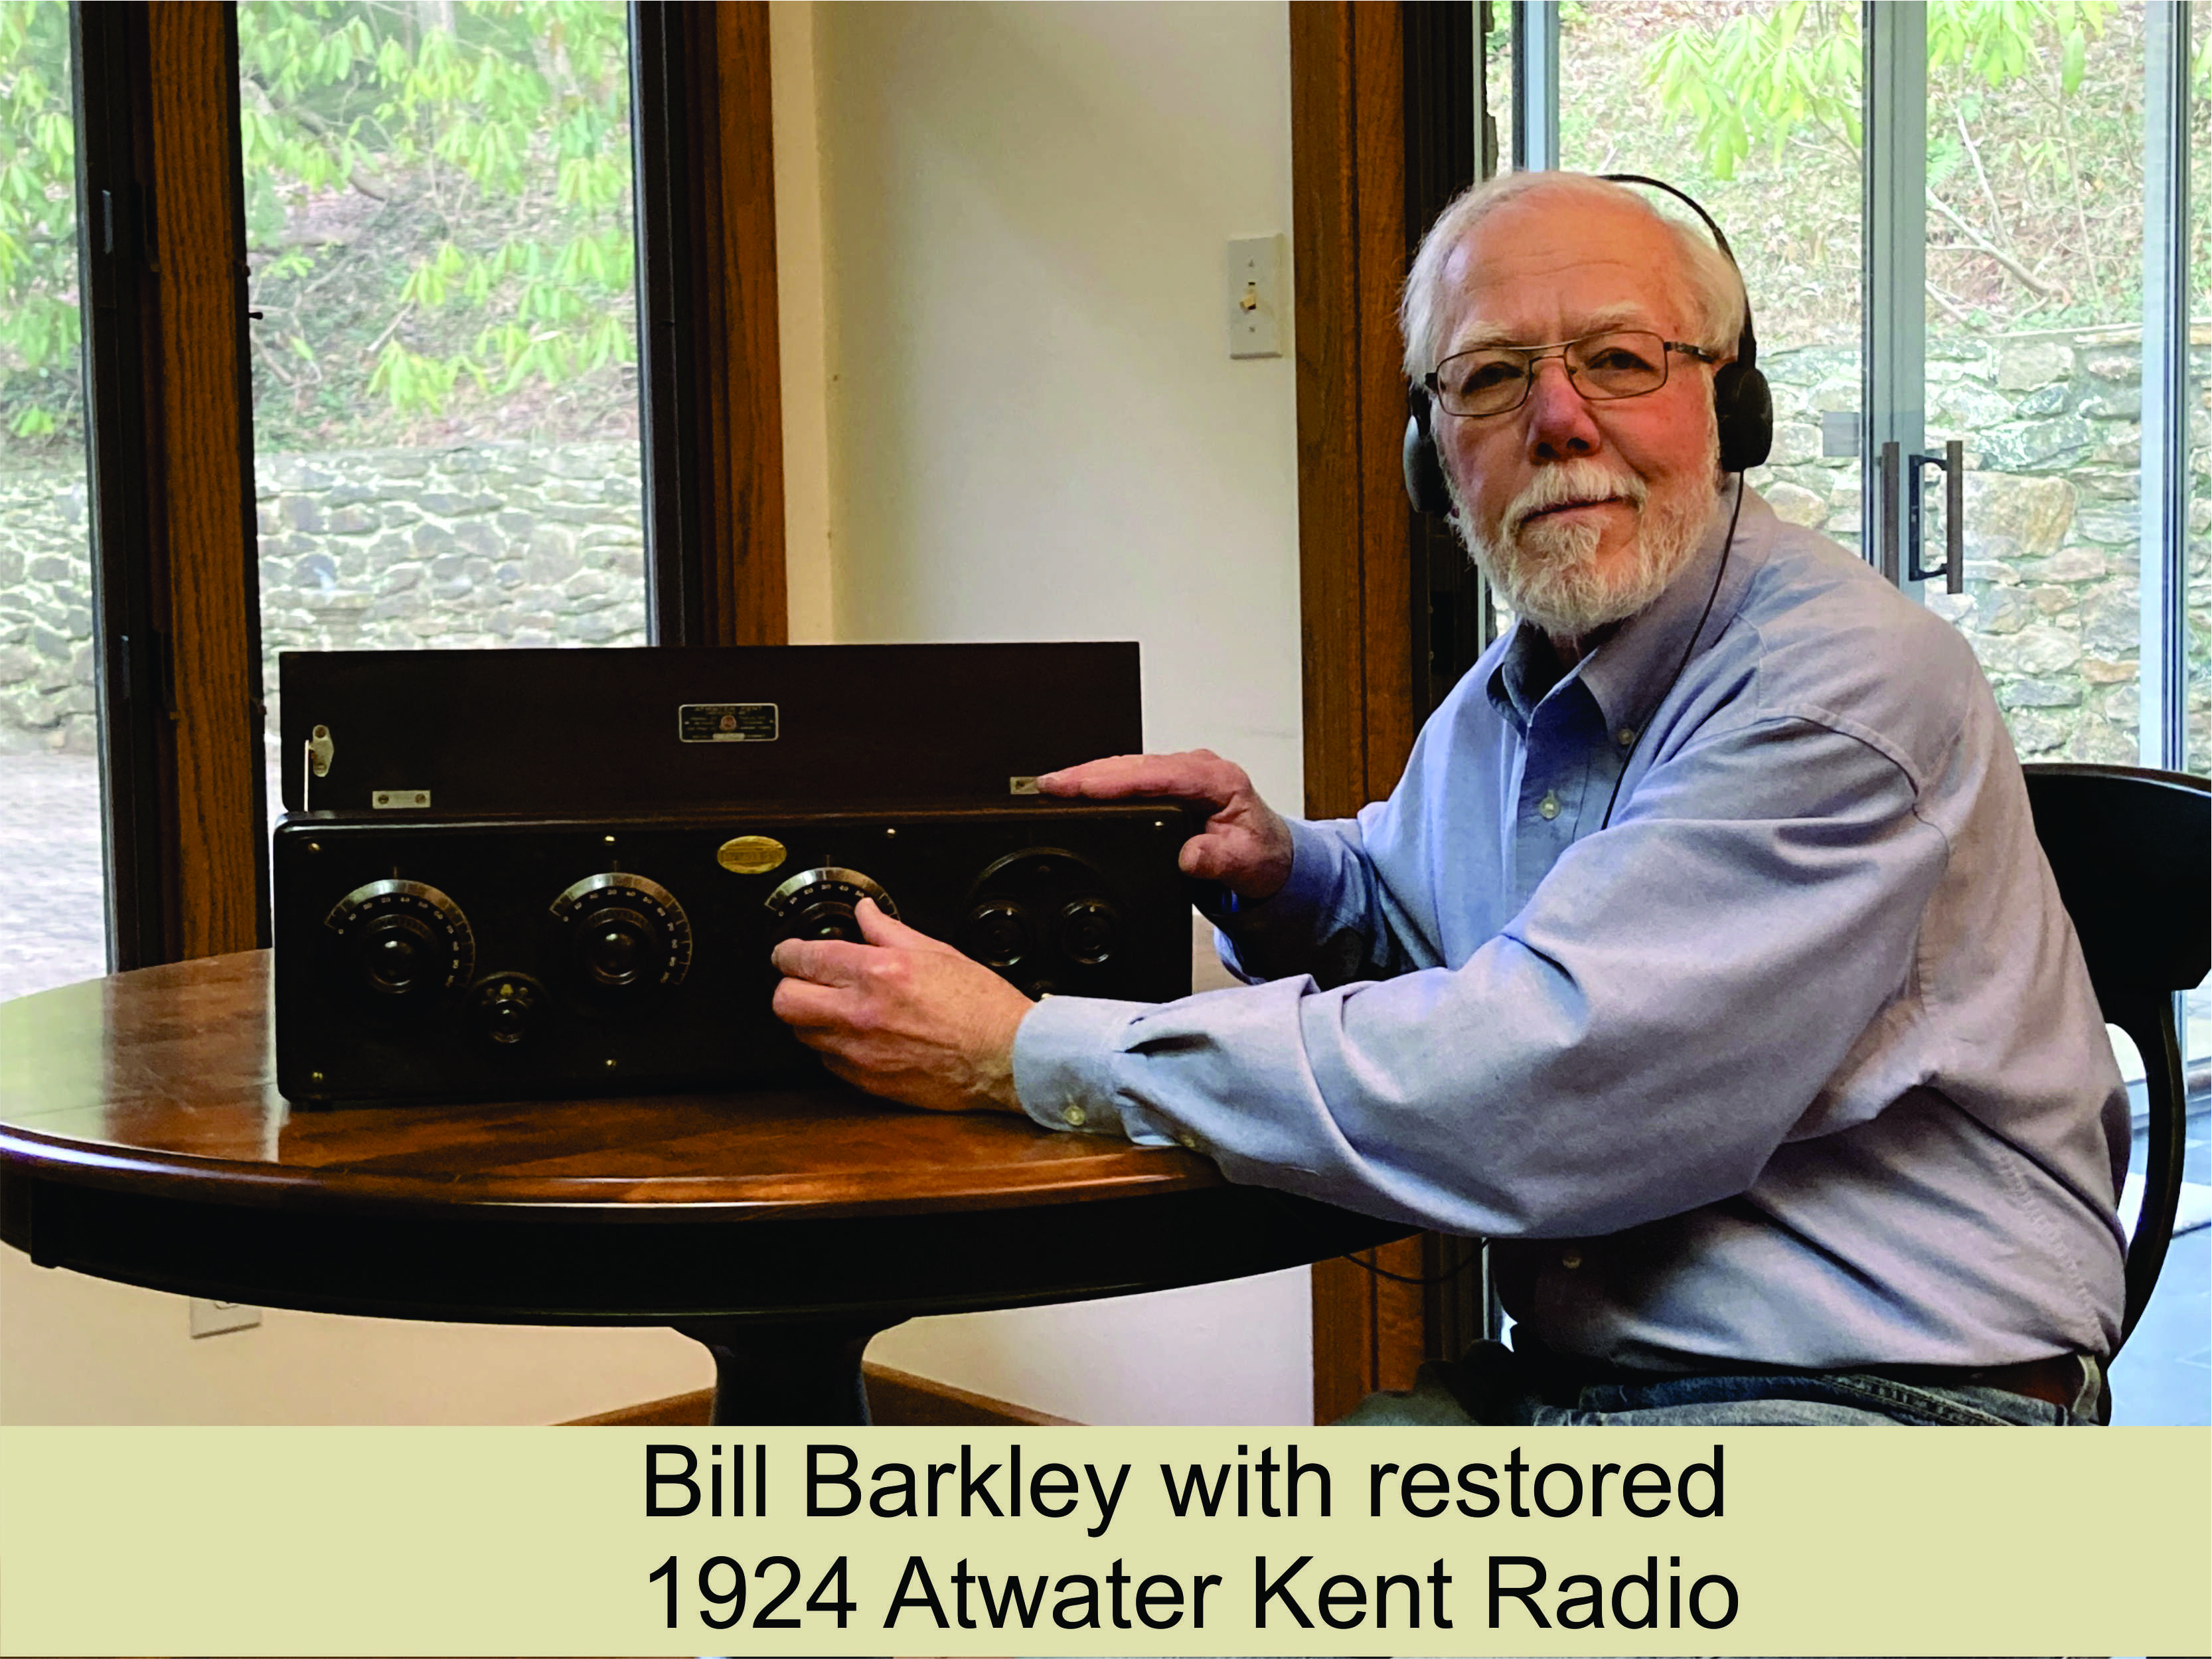
It is generally our Senior Members who have the knowledge, experience,
and memories of this major period of our history. Bill Barkley is using
his to help preserve and share our heritage by collecting and restoring
radios from that era. He has
just finished the restoration of the Atwater Kent receiver from 1924
shown here.
 |
 |
Bill would like to communicate with anyone interested in restoring old
radios, and especially those who need parts and tubes that he might
have. He can be contacted at:
Bill Barkley ,
bill.wncieee@bellsouth.net.
The Asheville Radio Museum with an extensive collection of radios and
educational exhibits can be
visited (virtually) at:
https://www.avlradiomuseum.org/
Bora Karayaka is an Engineering faculty at College of Engineering and
Technology,
 Western Carolina University. He has worked as a Senior
Engineer for smart grid and wireless
communication industries for over ten years. Currently he is leading the
efforts to establish electric power engineering as a discipline within
the School of Engineering + Technology. This has involved outreach and
recruiting activities as well as developing and delivering the
curriculum.
Western Carolina University. He has worked as a Senior
Engineer for smart grid and wireless
communication industries for over ten years. Currently he is leading the
efforts to establish electric power engineering as a discipline within
the School of Engineering + Technology. This has involved outreach and
recruiting activities as well as developing and delivering the
curriculum.
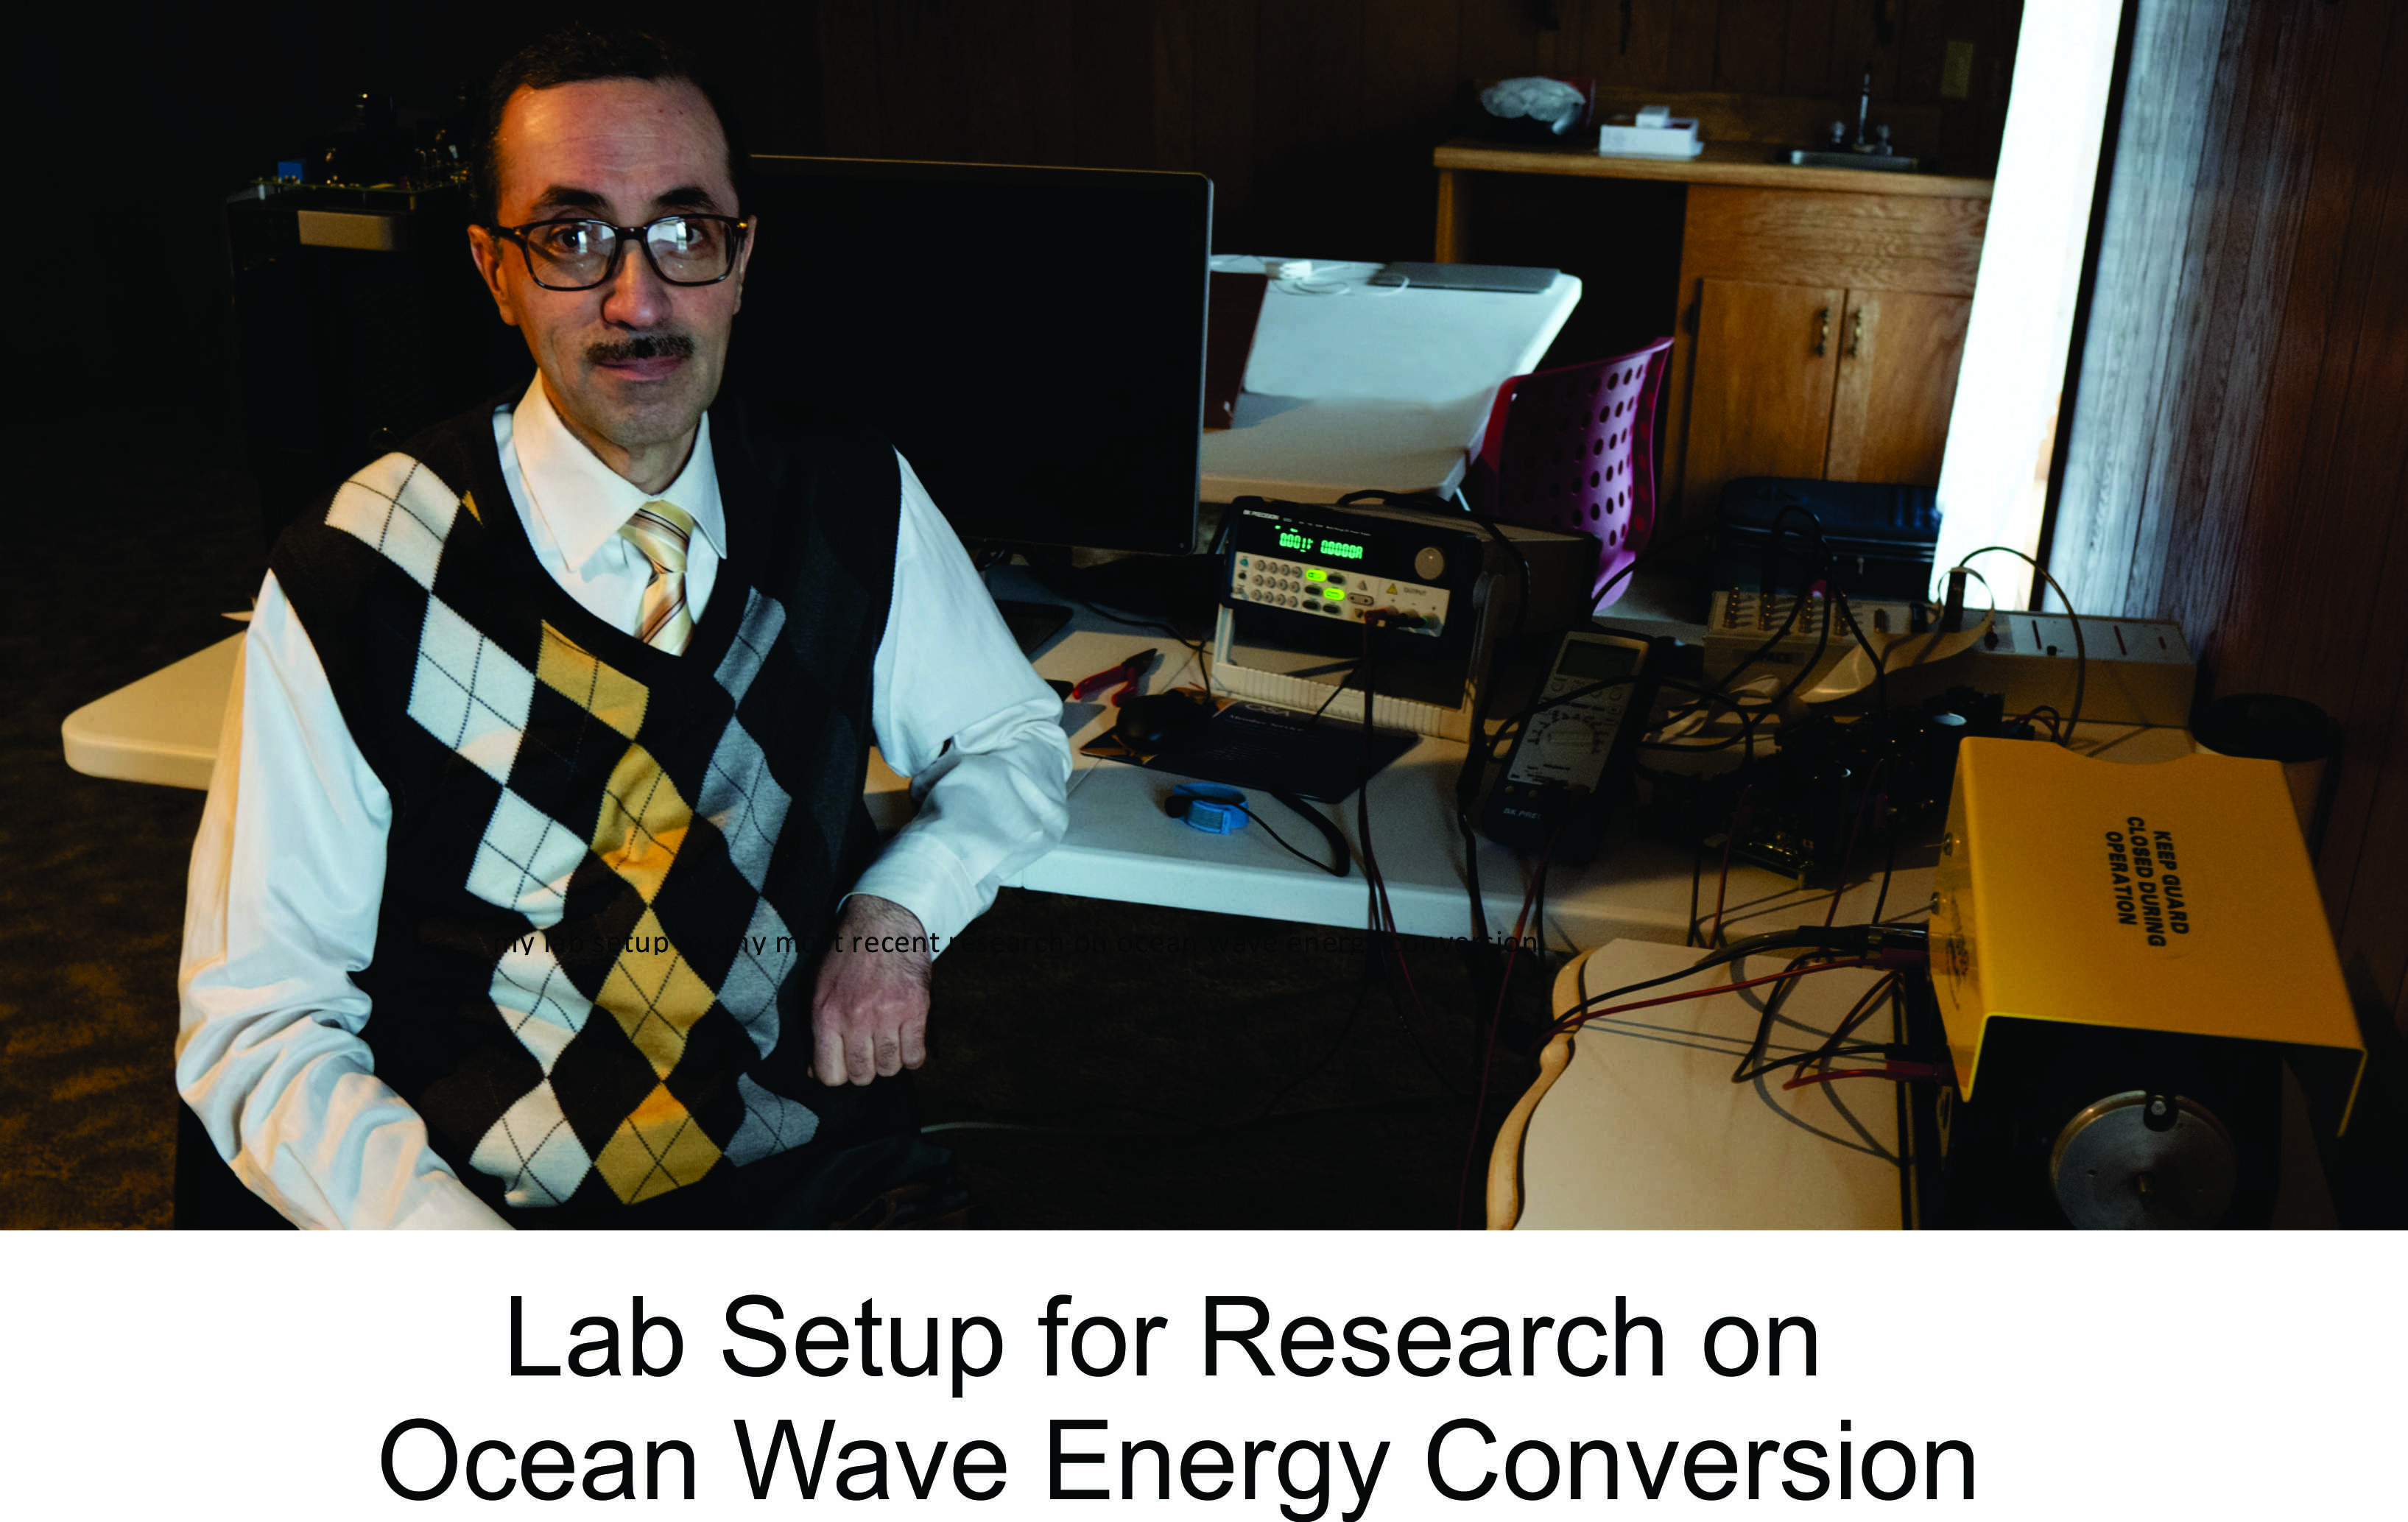
Dr. Karayaka’s research interests
include ocean wave energy, engineering education, identification,
modeling and control for electrical machines and smart grid. He received
his B.S. and M.S. degrees from Istanbul Technical University in Control
and Computer Engineering and his PhD degree in Electrical Engineering
from The Ohio State University.
Within the WNC IEEE he serves as Chair of
WNC section Power & Energy Society.
Bora can be contacted at; hbkarayaka@wcu.edu